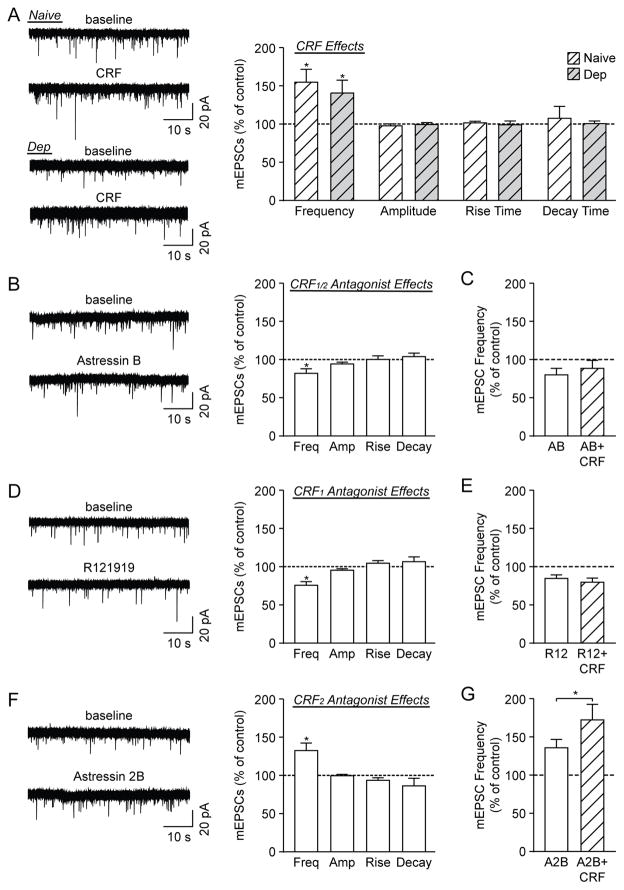
Figure 4. CRF1 activation promotes action potential-independent glutamate release.
A) Left: Representative mEPSC traces from CeA neurons of naive and ethanol-dependent (Dep) rats in baseline conditions and during 100 nM CRF superfusion. Right: CRF significantly increased mEPSC frequencies in the CeA of naïve and ethanol-dependent rats (9 cells from 4 naïve rats, 10 cells from 5 dependent rats). B) Left: Representative mEPSCs from CeA neurons of naive rats in baseline conditions and during 200 nM Astressin B (AB) superfusion. Right: AB significantly reduced the mEPSC frequency, but had no effect on amplitudes or kinetics (10 cells from 6 naïve rats). C) Co-application of CRF and AB did not significantly alter the mEPSC frequency compared to AB alone (7 cells from 5 naïve rats). D) Left: Representative mEPSCs from CeA neurons of naive rats in baseline conditions and during 1 μM R121919 (R12) superfusion. Right: R12 significantly reduced the mEPSC frequency, but had no effect on amplitudes or kinetics (17 cells from 10 naïve rats). E) CRF+R12 did not significantly alter the mEPSC frequency compared to R12 alone (7 cells from 4 naïve rats). F) Left: Representative mEPSCs from CeA neurons of naive rats in baseline conditions and during 1 μM Astressin 2B (A2B) superfusion. Right: A2B significantly increased the mEPSC frequency, but had no effect on amplitudes or kinetics (7 cells from 5 naïve rats). G) CRF+A2B significantly increased the mEPSC frequency compared to A2B alone (6 cells from 5 naïve rats). *p<0.05 by one-sample or paired t-test, as appropriate.

