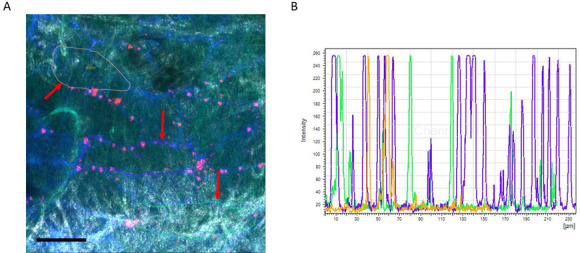
Figure 7. Example of TPLSM imaging of Dil-LDL extravasation in the carotid artery.

A. Max. image showing XY projection (Dil-LDL in Red and CD31 in Blue). The arterial wall extracellular matrix components collagen (white, tunica adventitia) and elastin (green, tunica media) are visualized using the intrinsic signals of autofluorescence and second harmonics generation. Image also includes analysis method showing selection of ROIs (red arrows). Scale bar = 50 µm. B. Example of intensity scheme showing individual peaks representing the Dil-LDL particles.
