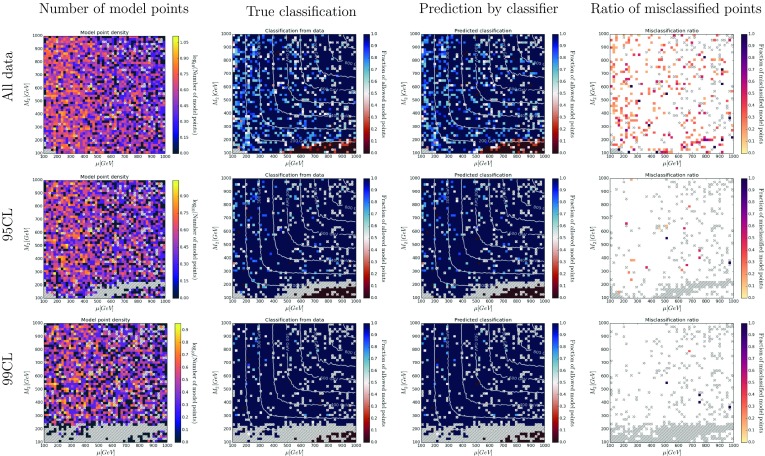
Fig. 12.

Color histograms for a projection of the 19-dimensional pMSSM parameter space on the – plane after imposing the constraints on the soft breaking parameters summarized in Table 8 (right). The contours denote the mass of . The color in the second and third column indicates the fraction of allowed data points. The last column shows the fraction of misclassified points. The dashed bins contain no data points
