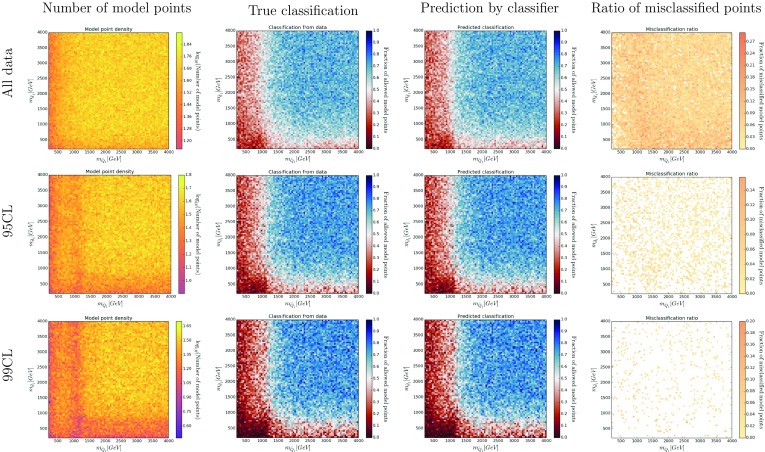
Fig. 20.

Color histograms for a projection of the 19-dimensional pMSSM parameter space on the – plane. The color in the second and third column indicates the fraction of allowed data points for the true classification and the out-of-bag prediction, respectively. The last column shows the fraction of misclassified model points
