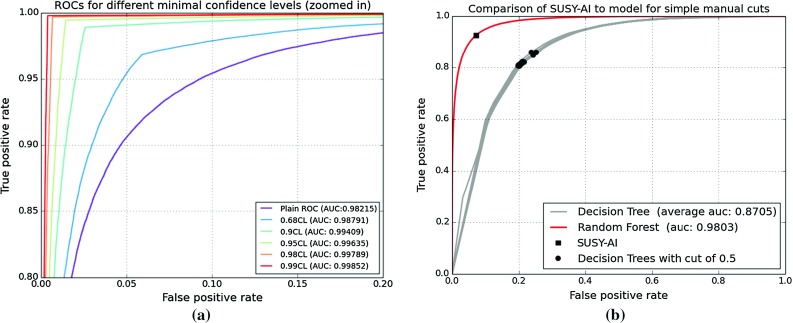
Fig. 4.

a ROC curves for different minimum CLs following from an analysis of Fig. 3. Note that only the upper left corner of the full ROC curve is shown. b ROCs for SUSY-AI and 20 decision trees (ROCs overlap here). The decision trees model educated manual cuts on the dataset. The square marker indicates the location of SUSY-AI performance without a cut on CL, while discs denote different decision trees
