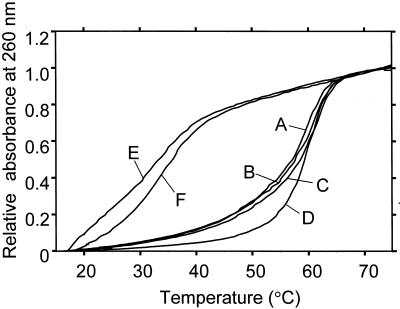
Figure 3.
Melting curves of MSP-A, B and C paired with their complementary oligonucleotides (curves A, B and C, respectively), a double-stranded oligonucleotide (21 bp, curve D), and a MSP-A paired with an uncomplementary oligonucleotide tag-b and -c (curves E and F, respectively). The melting curves were obtained from 1.52 µM of the oligonucleotide pairs. The curves are normalised with the absorbance of 1.0 at 75°C. The data was collected by a U-3300 spectrometer coupled with thermo-programmer (Hitachi, Japan).

