
Figure 1.
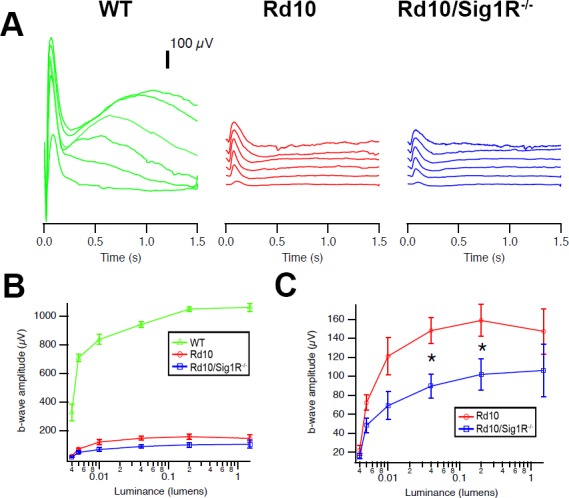
Scotopic ERG. (A) Scotopic ERG traces. Averaged scotopic ERG responses to 5-ms flashes at a series of intensities in WT, rd10, and rd10/Sig1R−/− mice at P28; intensities are units of lumens. (B) Mean b-wave amplitudes. Data are the mean ± SEM of assessments of six to nine mice. (C) Enlargement of b-wave amplitude in rd10 and rd10/Sig1R−/−. *Significant difference between rd10 and rd10/Sig1R−/− mice (P < 0.05).