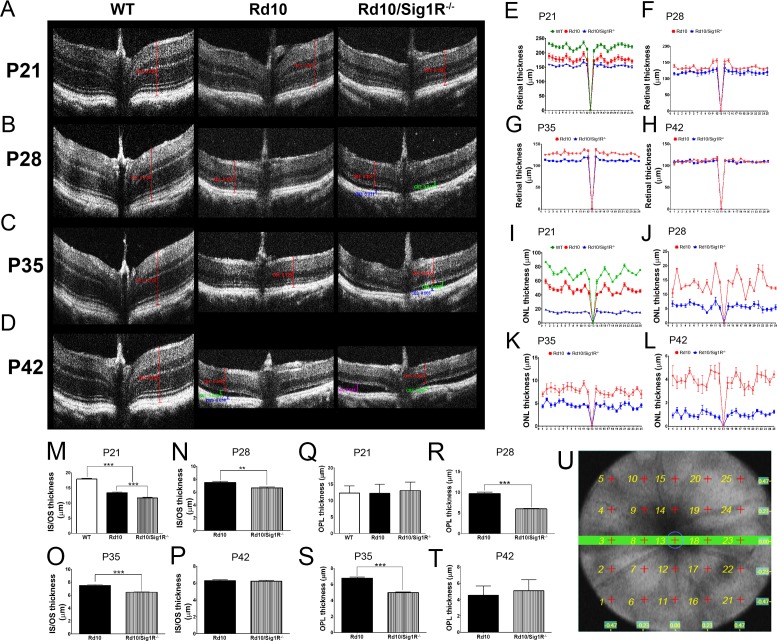
Figure 3.
SD-OCT assessment. (A–D) Representative SD-OCT data obtained from WT mice, rd10 mice, and rd10/Sig1R−/− mice at P21 (A), P28 (B), P35 (C), and P42 (D). (E–T) Data for segmentation analysis for TRT at P21, P28, P35, and P42 (E–H), for ONL thickness at P21 to P42 (I–L), for IS/OS thickness at P21 to P42 (M–P), and for OPL thickness at P21 to P42 (Q–T). (U) The template (5 × 5 grid) for the OCT measurements. It represents the 25 points within the retina where retinal thickness is measured. Data are the mean ± SEM of analyses in 4 to 10 mice per group at each age. **P < 0.01, ***P < 0.001. Note: For the OCT analyses, the x-axis represents the 25 points shown in (U), with point #13 representing the optic nerve, where the thickness is always zero.

