
Figure 7.
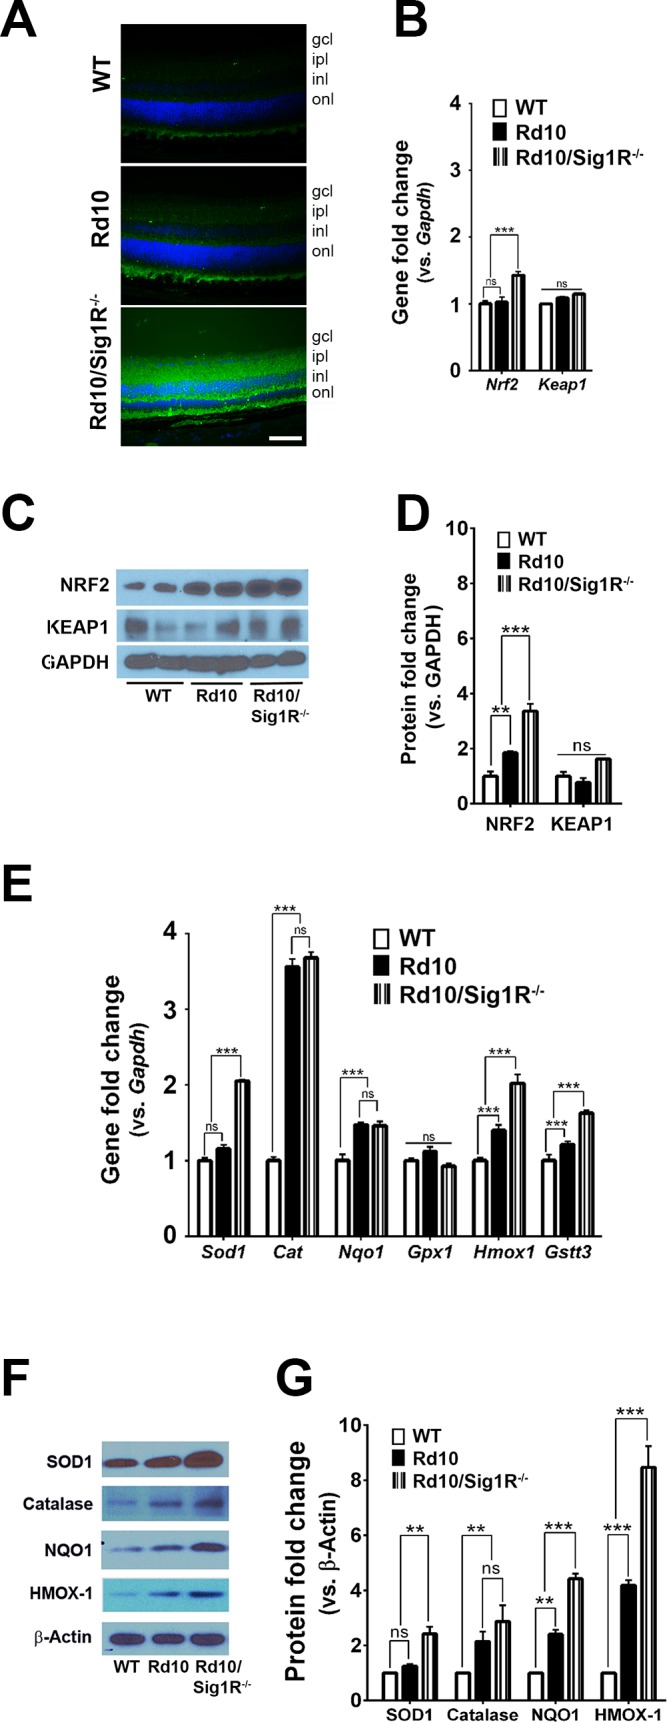
Assessment of oxidative stress–related genes and proteins. Immunodetection of CM-H2DCFDA (green fluorescence on reaction with reactive oxygen species) in retinal cryosections of (A) WT, rd10, and rd10/Sig1R−/− at P21. Nuclei are labeled with DAPI (blue). Calibration bar: 50 μm. RNA was isolated from neural retinas and subjected to quantitative RT-PCR (qRT-PCR) analysis of (B) Nrf2, Keap1. Neural retinas harvested from WT, rd10, and rd10/Sig1R−/− mice at P21 were used for isolation of protein. Representative immunoblots detecting (C) NRF2 and KEAP1. (D) Band densities of NRF2 and KEAP1 quantified densitometrically and expressed as fold change versus glyceraldehyde 3-phosphate dehydrogenase (GAPDH). RNA was isolated from neural retinas and subjected to qRT-PCR analysis of (E) Sod1, Catalase, Nqo1, Gpx1, Hmox1, and Gstt3. (F) Neural retinas harvested from WT, rd10, and rd10/Sig1R−/− mice at P21 were used for isolation of protein. Representative immunoblots detecting SOD1, Catalase, NQO1, HMOX1. (G) Band densities of SOD1, Catalase, NQO1, HMOX1 quantified densitometrically and expressed as fold change versus β-Actin. Primer pairs for PCR studies are provided in Supplementary Table S3, and antibodies for immunodetection are provided in Supplementary Table S2. Data are the mean ± SEM of three assays from three different mice retinas in each group. *P < 0.05; **P < 0.01; ***P < 0.001.