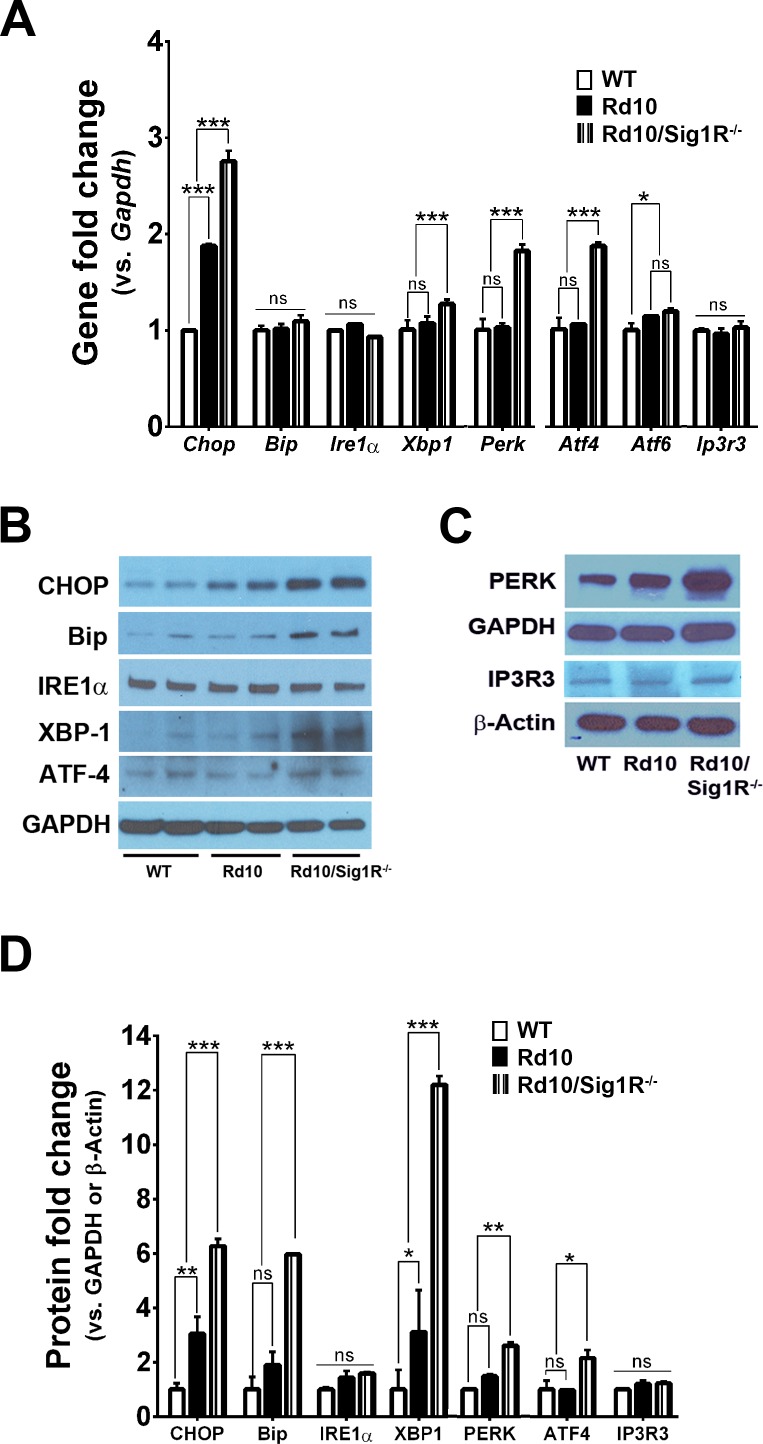
Figure 8.
Assessment of ER stress–related genes and proteins. (A) RNA was isolated from neural retinas and subjected to quantitative real-time RT-PCR analysis of Ire1α, Xbp1, Atf4, Chop, Bip, Perk, Ip3r3, and Atf6. Primer pairs are listed in Supplementary Table S3. Data are the mean ± SEM of three assays from three different mice retinas in each group. *P < 0.05; **P < 0.01; ***P < 0.001. (B, C) Neural retinas harvested from WT, rd10, and rd10/Sig1R−/− mice at P21 were used for isolation of protein. Representative immunoblots detecting IRE1α, XBP1, ATF4, CHOP, BiP, PERK, IP3R3, and p-eIF2α/eIF2α are shown in (B) and (C). GAPDH and β-Actin were the internal controls, separately. (D) Band densities, quantified densitometrically and expressed as fold change versus GAPDH or β-Actin. Data are the mean ± SEM of three or four assays from different retina of WT, rd10, and rd10/Sig1R−/− mice. *P < 0.05; **P < 0.01; ***P < 0.001.

