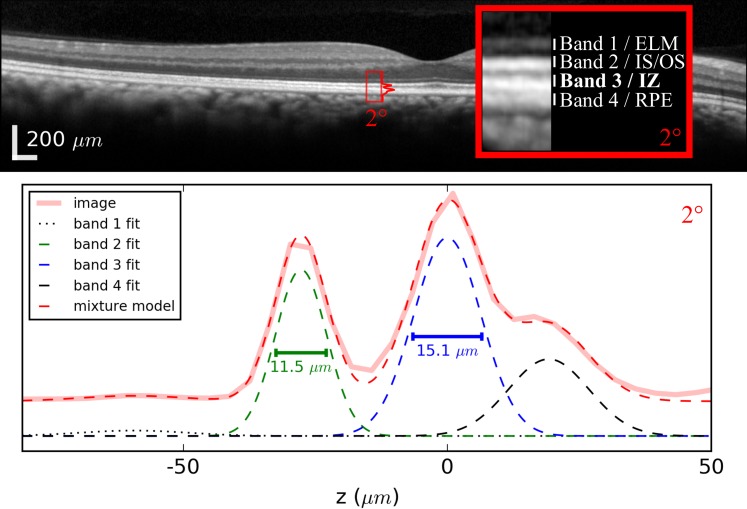
Figure 3.
Peak width measured by fitting a conventional OCT image with a Gaussian mixture model. Top: an OCT (Heidelberg Engineering) B-scan of a subject without known retinal disease. Peaks were measured at 1-degree intervals between 1° and 8°. Below: plot of the axial profile (solid pink) for the 2° location. Similar profiles were computed at 1-degree intervals between 1° and 7°. For each axial profile, a Gaussian mixture model was used to fit the four peaks corresponding to outer retinal bands 1, 2, 3, and 4 (shown in black dotted, green, blue, and black dashed). The model was used to compute full-width half-maximum peak widths and the distance between peaks 2 and 3. Plots of the profile and mixture model are offset vertically from the Gaussian components of the model in order to facilitate visibility. The wide-field image at the top is shown in the instrument's automatic log scale, while the inset image and plot were converted to linear scale

