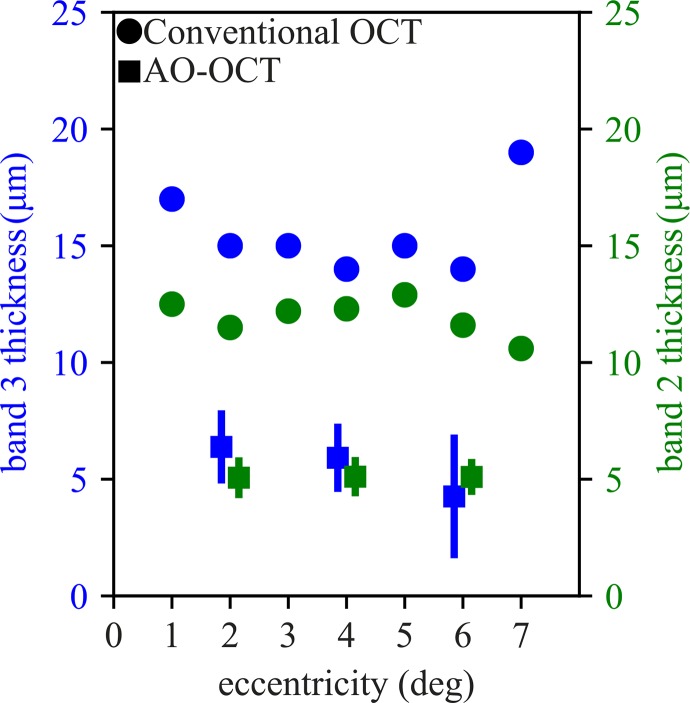
Figure 6.
The thicknesses of band 3 across retinal eccentricities. Thicknesses of bands were determined by fitting each cone's axial linear intensity profile with a Gaussian function. Average AO-OCT band 3 thickness (blue squares) ranged from 6.4 μm at 2° to 4.3 μm at 6°, but dependence upon eccentricity was not significant. Average AO-OCT band 2 thickness (green squares) was 5.1 μm at all three eccentricities. The similarity between thickness measurements for the two bands suggests similar physical origins, namely one or more reflective surfaces spanning no more than a few microns in depth. Error bars show standard deviation of measurements, which appear larger for band 3 (green) than for corresponding measurements of band 2 (blue), which may be due to additional optical complexity of scattering near the outer segment tips. The axial PSF is 4.7-μm wide, which is at most 1.7 μm smaller than the mean thickness measured with AO-OCT, and within the error range for most measurements. Corresponding measurements of bands 2 and 3 from OCT (Heidelberg Engineering) B-scans are plotted with green and blue circles, respectively. For adaptive optics OCT measurements, markers offset horizontally for visibility.

