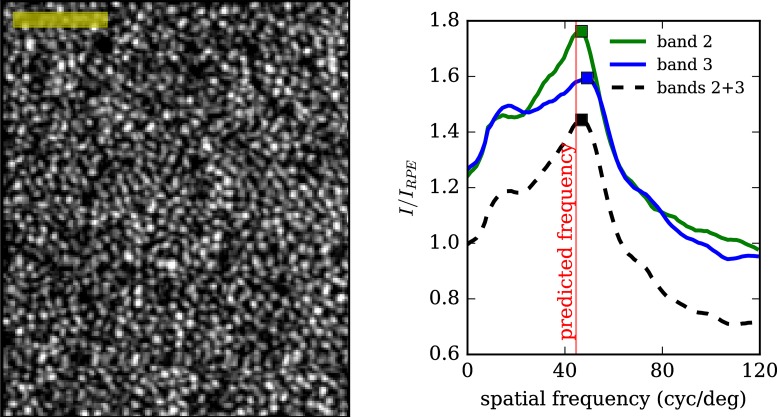
Figure 10.
Power spectra of areal projections of bands 2 and 3 reveal distinct peaks. Left: an aerial image of the cone mosaic, acquired at 4° from subject 2, generated by averaging projections from bands 2 and 3. Right: the power spectrum of the same images (bands 2, 3, and 2 + 3), computed by Fourier transformation and plotted as a fraction of the corresponding RPE power spectrum. The power spectrum peak is close to the frequency corresponding to regularly tiled cones at densities reported in the literature. Scale Bar: 50 μm.

