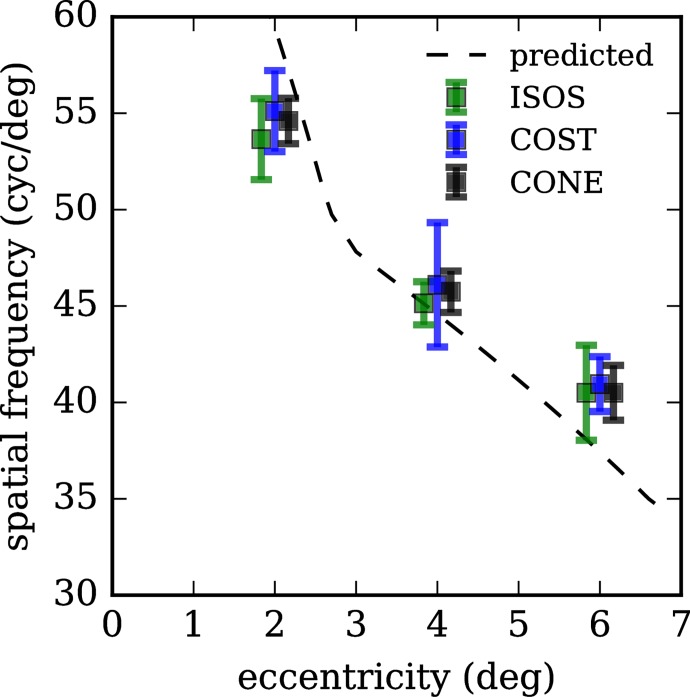
Figure 11.
Peaks of power spectra for bands 2, 3, and their average, across retinal eccentricities. Peak spatial frequencies of features in bands 2 and 3 decrease with increasing retinal eccentricity. This observation provides further evidence that the features at the two levels are correlated. Moreover, their agreement with predicted spatial frequencies (computed from cone density measurements reported in the literature19) provides confirmation that these are cone photoreceptors. Error bars represent 1 SD. At each eccentricity, markers are offset horizontally for visibility.

