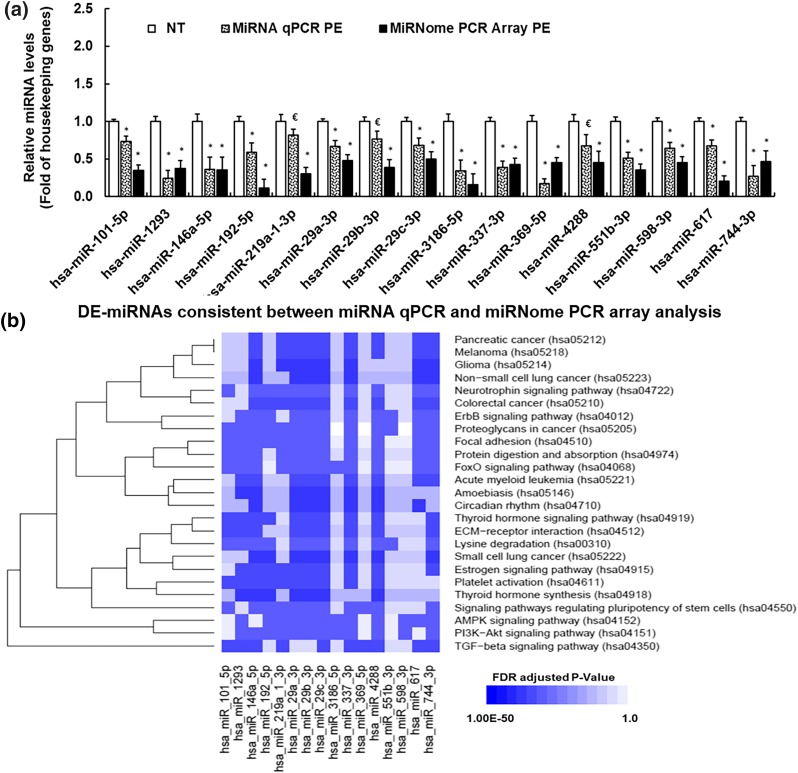
Figure 1.
(a) RT-qPCR validation of preeclampsia-induced DE-miRNAs in PE vs NT P0-HUVECs. *Differ (P < 0.05, Mann–Whitney Rank Sum Test) from NT; €differ from NT with a borderline P value (0.05 < P < 0.1). (b) Kyoto Encyclopedia of Genes and Genomes (KEGG) signaling pathways associated with preeclampsia-induced DE-miRNAs and their targeted genes. MiRNA targeted gene/pathway enrichment analyses were performed using the DIANA Tools and KEGG pathway database. The 25 significantly enriched (FDR adjusted P < 0.05) pathways were determined by the Fisher’s exact test with FDR P value correction for multiple testing. x-axis: number of DE-miRNA associated with each pathway; y-axis: names of the enriched KEGG signaling pathways. *Pathways that are associated with miR-29a/c-3p.

