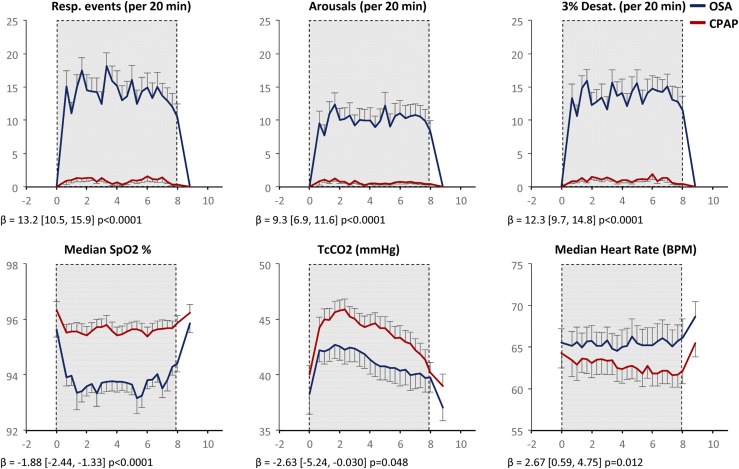
Figure 1.
Effect of CPAP withdrawal on sleep physiology. Data are plotted as mean ± standard error of the mean (n = 31) at 20-minute intervals. OSA data are shown in blue; CPAP data are shown in red. The shaded region, from 11 pm to 7 am, denotes the sleep/lights out period. Respiratory events = (apneas + hypopneas) in preceding 20 minutes. β coefficients and P values reflect differences between OSA and CPAP using mixed effects models. BPM, beats per minute.

