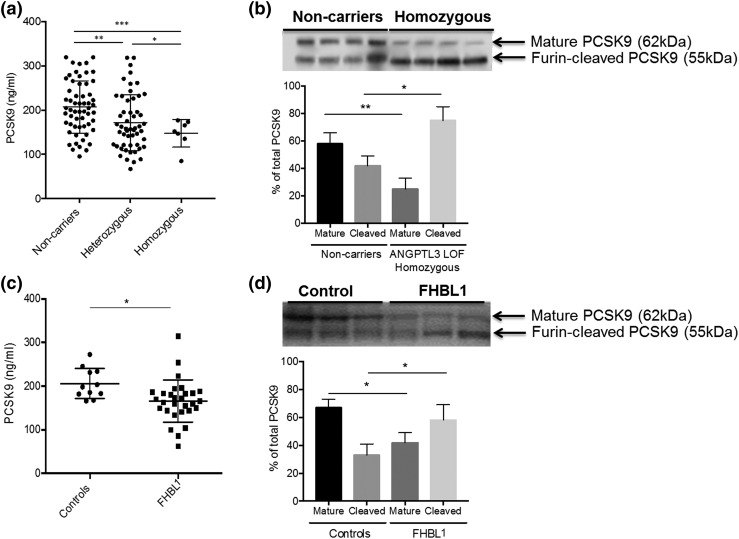
Figure 3.
Effect of low LDL levels on plasma PCSK9: (a) group comparison for total PCSK9 levels in the ANGPTL3 cohort; (b) immunoblot (upper) and quantification (lower) for plasma PCSK9 molecular forms in the ANGPTL3 cohort; (c) group comparison for total PCSK9 levels in the FHBL1 cohort; and (d) Immunoblot (upper) and quantification (lower) for plasma PCSK9 molecular form in the FHBL1 cohort. *P < 0.05, **P < 0.01,***P < 0.001.

