
Fig. 1. A strong spatial gradient to coral loss in the Florida Keys.
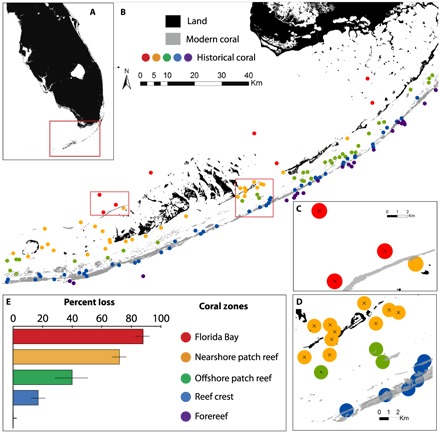
(A) Study area. (B). Modern and historical coral occurrences in the Florida Keys. The color of dots corresponds with the five delineated coral zones. (C) Enlarged area demonstrates the loss of coral from Florida Bay (red). (D) Enlarged area (Bahia Honda) demonstrates the loss of the nearshore patch reef (yellow) and the persistence of coral in the reef crest zone (blue). For (C) and (D), corals that no longer remain are indicated with an X. (E) Percent loss by zone. Bars represent the mean estimate of loss derived from three distance thresholds diameters (0.25, 0.5, and 0.75 km). Error bars represent the SEs across those three estimates.