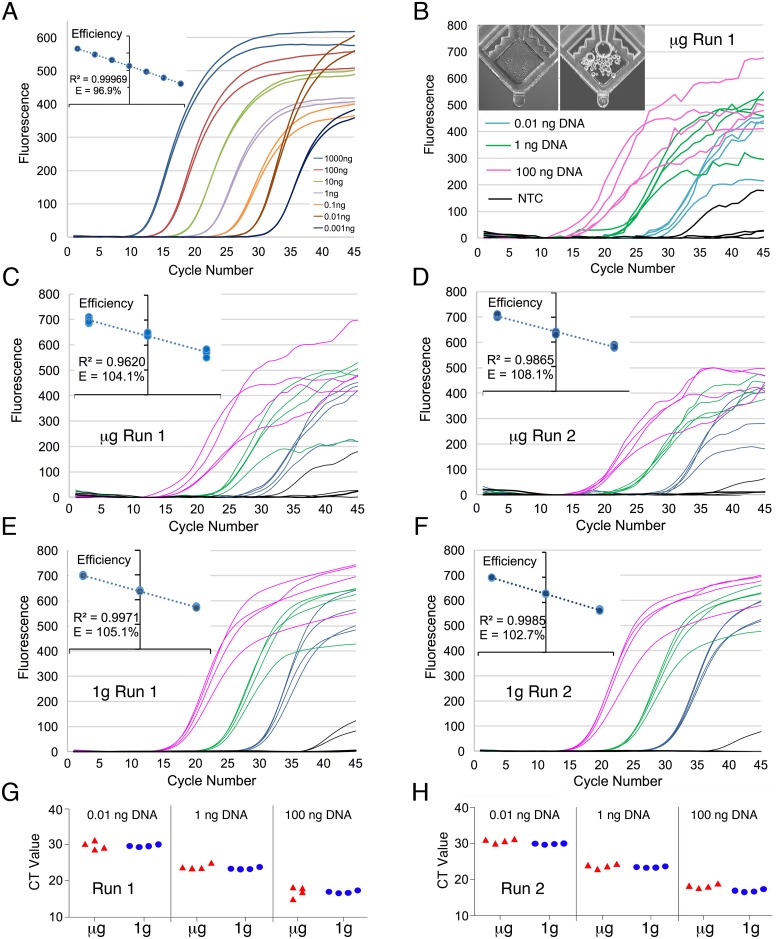
Fig 2. qPCR validation in microgravity.
(A) qPCR assays targeting the E. coli 16S ribosomal gene were validated on the ground using seven tenfold dilutions of template to measure sensitivity and efficiency (inset). (B) Amplification curve from qPCR run conducted on the ISS with photo of a representative tube pre- and post- run in microgravity (inset). (C-F) qPCR amplification curves from the microgravity (C & D) and 1 g control (E & F) runs. All curves use the default SmartCycler values with the exception that the boxcar correction is set to 3. Efficiency graphs are shown on the insets. (G & H) Ct values for low (0.01 ng/test), mid (1 ng/test), and high (100 ng/test) assays during both experimental runs are shown using scatter plots with jitter. μg = microgravity.

