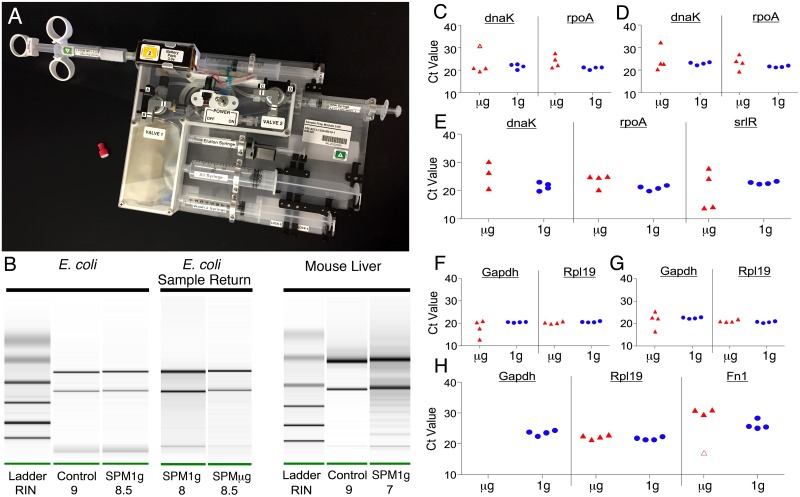
Fig 3. RNA isolation and RT-qPCR in microgravity.
(A) Photo of SPM. (B) Typical RNA quality from SPM with E. coli (left panel) and mouse liver (right panel), control Qiagen (left lane) SPM (right lane). Center panel shows RNA quality from the 1 g control (left lane) and the returned microgravity sample from ISS (right lane). (C-E) Scatter plots with jitter of the microgravity and 1 g control E. coli singleplex (C), duplex (D) and triplex (E) reactions. One outlier is indicated by the open marker in C. One of the microgravity triplex tubes did not give a dnaK-FAM signal (E). (F-H) Scatter plots with jitter of the microgravity and 1 g control mouse liver singleplex (F), duplex (G) and triplex (H) reactions. One outlier from the microgravity triplex fn1 plot is indicated by the open marker and no gapdh-FAM signal was seen in the microgravity triplex reactions (H).

