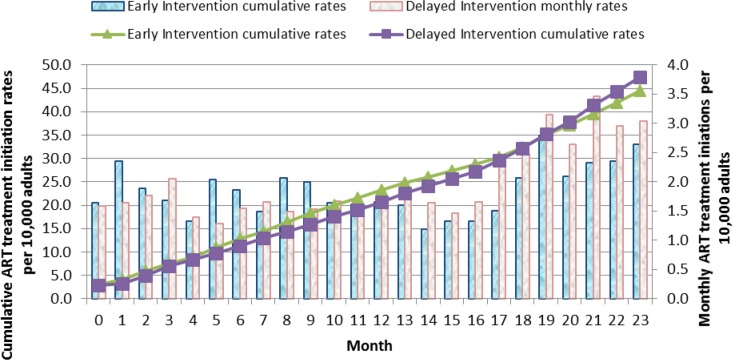
Fig 7. Monthly and cumulative ART treatment initiations rates per 10,000 adults: Results in individuals aged 12 years and above over the 23 months of the study before the scale up of the Delayed intervention arm are shown.
The line graphs represent the cumulative ART initiation rates. The green triangle line graph indicates the Early Intervention arm and the purple cubed line graph indicates the Delayed Intervention arm. The solid bar graphs represent the monthly ART initiation rates per 1,000 adults for every month over the 23 months of the study. The blue bars represent the Early Intervention Arm while the grey bars represent the Delayed Intervention Arm.

