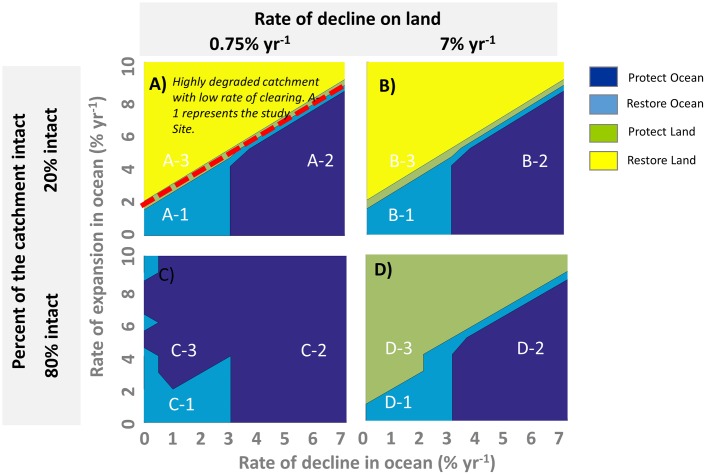
Fig 4. Impact of $50 million per year investment in land- or ocean-based conservation actions on marine ecosystems affected by land- and ocean- based impacts after 30 years.
Panels A–D give results for 4 different ecological contexts for the catchment and marine ecosystems. Two parameters representing the landscape are varied: percentage of the catchment that is intact (e.g., % remnant vegetation) and the background rate of decline of habitats on land (percent per year). X- and Y-axes indicate the rate of expansion (recovery) and decline (percent per year) of the marine ecosystem. In A, ‘A-1’ is thought to best represent the study system (marine restoration is predicted to be the most cost-effective action), whereas ‘A-2’ and ‘A-3’ highlight contexts where marine protection and terrestrial restoration would be the most cost-effective actions, respectively. Letter–number pairs are used to guide Fig 5.

