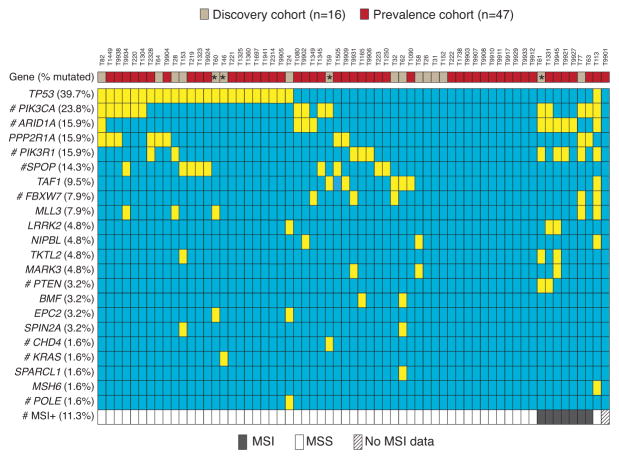
Figure 2. Somatic mutational status of 22 genes-of-interest, and the MSI status, in the discovery and prevalence screen CCECs.
(*) indicates four tumors with heterogeneous histology for which the CCEC component was sequenced. Genes and somatic mutation frequencies (% cases mutated) are shown. Somatic mutations (yellow) and MSI (gray) are indicated. (#) denotes genes for which a subset of cases (≤23 tumors) was previously analyzed for mutations and MSI as reported elsewhere 7, 15, 16, 27.

