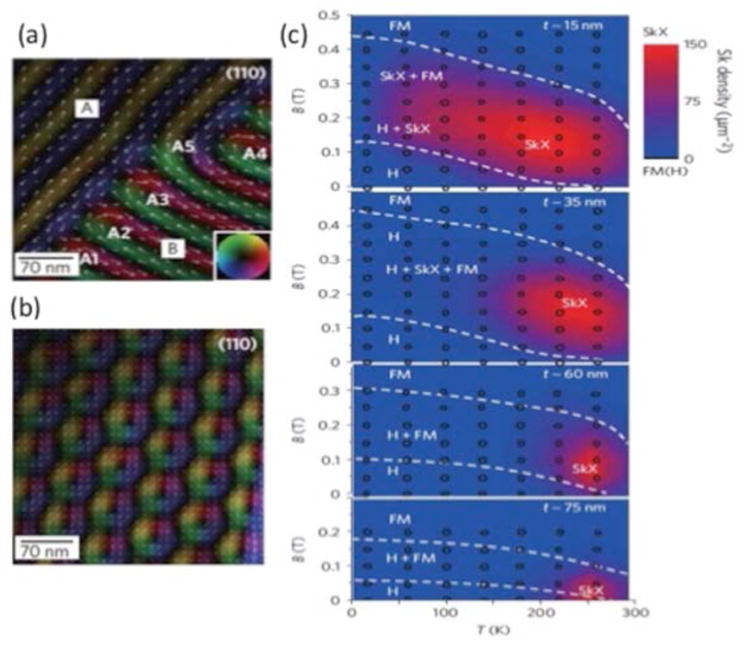
Figure 15.

Lorentz transmission electron microscopy (LTEM) images of B20 FeGe thin films in (a) the helical phase, showing magnetic chirality twinning at a structural twin boundary (A and B regions) and (b) the skyrmion phase induced by 0.1 T magnetic field applied normal to sample plane at 260 K. Color wheel (inset) and white arrows represent the magnetization direction at every point. c) Sample thickness dependence of skyrmion (SkX), helical (H) and ferromagnet (FM) phase diagram in the magnetic field B - temperature T plane. Color bar is the skyrmion density per square micron. [Yu et al., 2011]
