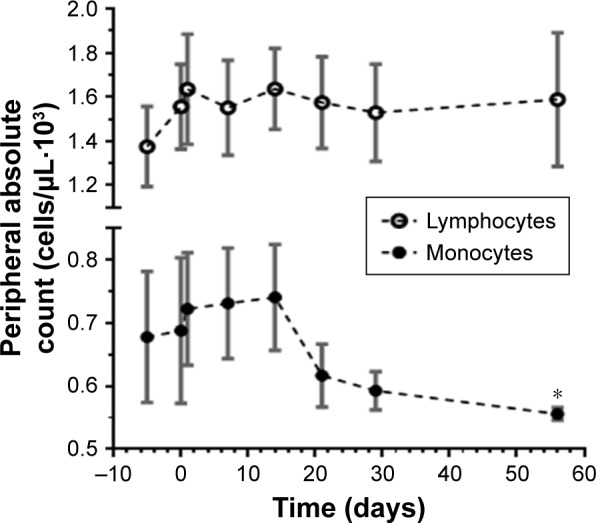
Figure 5.

Decrease in peripheral blood monocytic cells over time.
Notes: Absolute peripheral cell counts by automated differential during omaveloxolone treatment for all dose levels (n=11) are shown. Time 0 represents first day of dosing. Circles represent mean with standard error. *Denotes P=0.05 for one-sided t-test compared to baseline.
