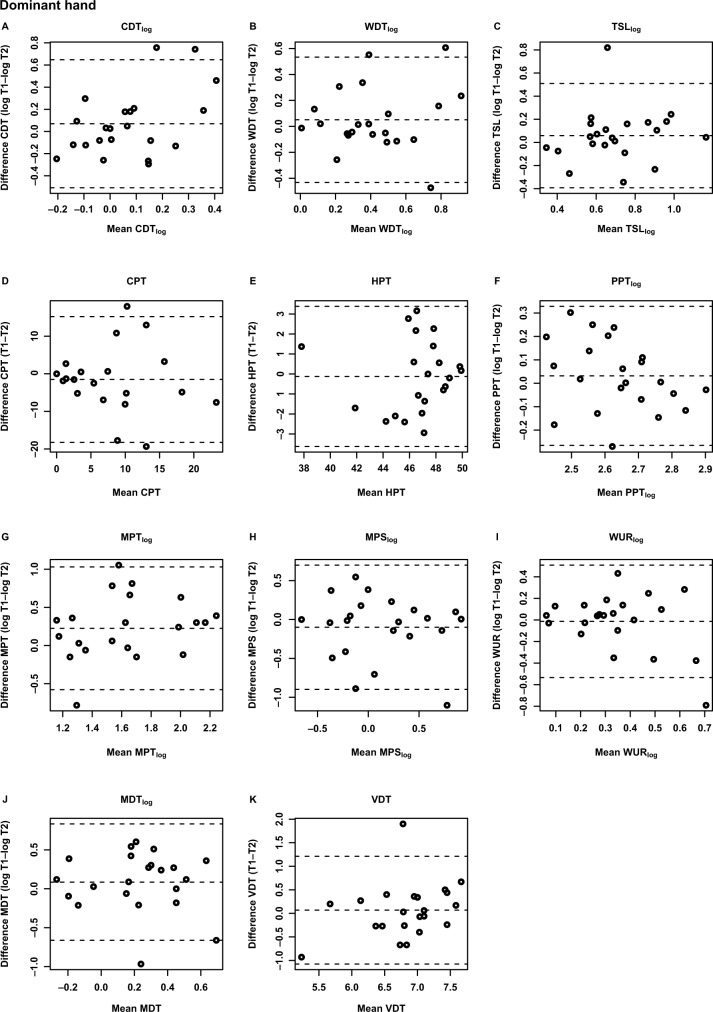
Figure 2.
Bland–Altman plots of the QST parameter for the dominant hand of healthy volunteers (N=22).
Notes: (A) CDTlog; (B) WDTlog; (C) TSLlog; (D) CPT; (E) HPT; (F) PPTlog; (G) MPTlog; (H) MPSlog; (I) WURlog; (J) MDTlog; (K) VDT; T1, measurement session 1; T2, measurement session 2. Bland–Altman plots with the differences between T1 and T2 values (vertical axis) plotted against the mean of each T1 and T2 value (horizontal axis) of each participant. The middle horizontal dashed line represents the mean difference between T1 and T2 of all subjects; upper and lower dashed lines indicate the limits of agreement (upper and lower limits of agreement, mean difference ±1.96 × SD).
Abbreviations: CDT, cold detection threshold; WDT, warm detection threshold; TSL, thermal sensory limen; CPT, cold pain threshold; HPT, heat pain threshold; PPT, pressure pain threshold; MPT, mechanical pain threshold; MPS, mechanical pain sensitivity; WUR, wind-up ratio; MDT, mechanical detection threshold; VDT, vibration detection threshold.

