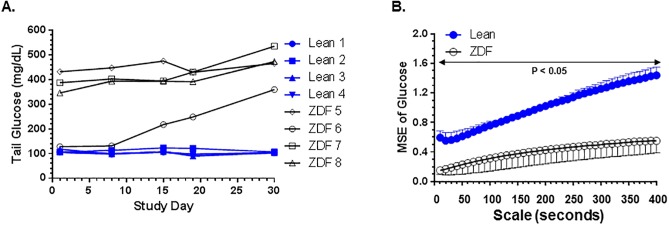
Fig 2.
(A). Glucose levels of diabetic ZDF rats and age-matched lean controls used for the study. Glucose levels of each rat is shown from Day 1 to Day 30 of study. N = 4 rats/grouop. (B). Multiscale entropy analysis on converted glucose levels over Day 3 to Day 14 in ZDF rats and lean littermate controls (mean and standard deviation). The P values in Fig 2B were calculated by performing unpaired t-tests for differences in mean sample entropy between the two groups of mice at the times scales indicated.

