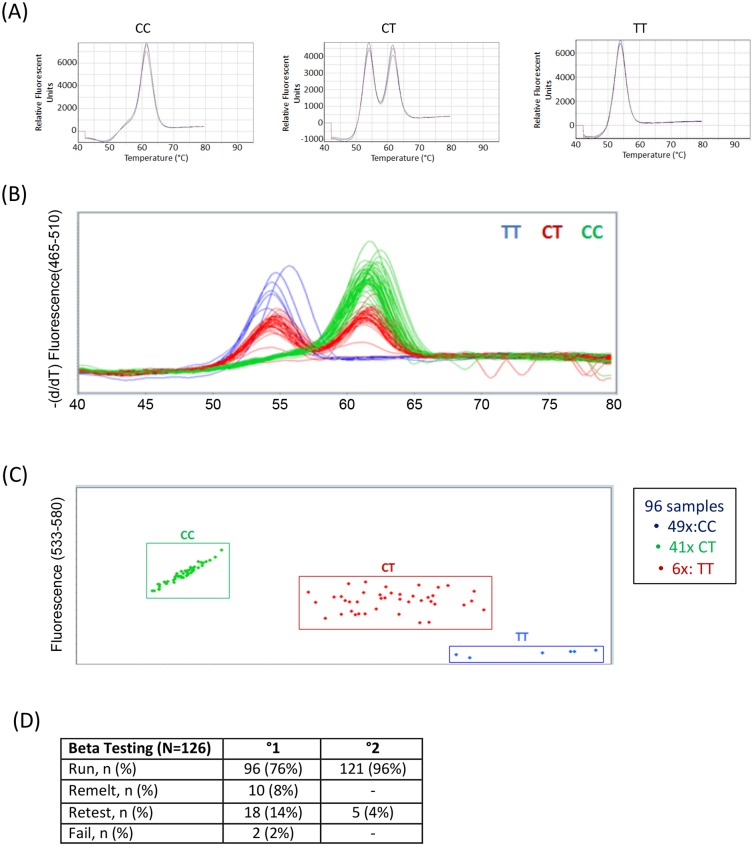
Fig 1. Comparison of Genedrive® and Taqman assays.
(A) Melt Curve Analysis for detection of SNP and template control. (B) Results of Genedrive assay on initial test samples. (C) Results of Taqman assay on initial test samples. (D) Summary of initial Beta test results in run, remelts, and retests prior to and after assay optimization.

