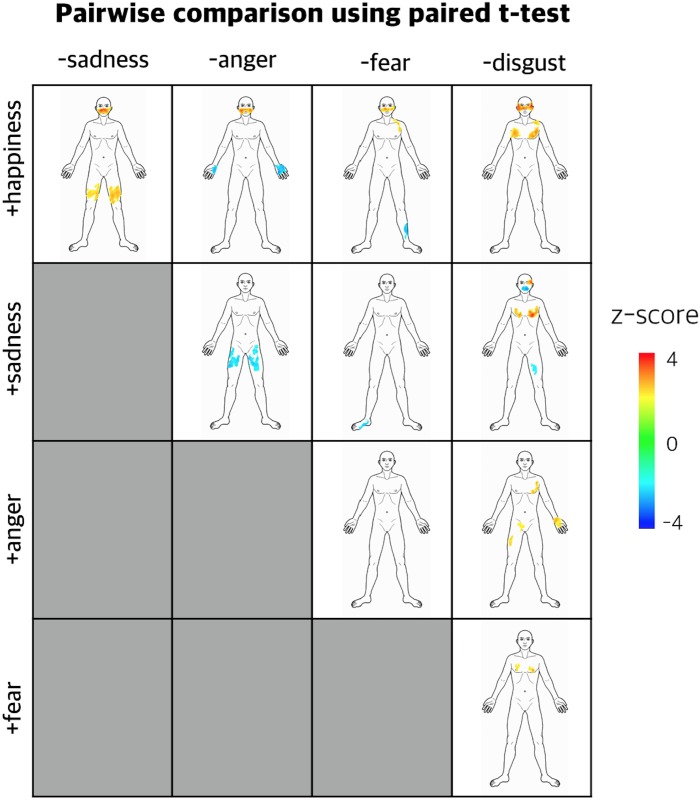
Fig 3. Statistical parametric maps comparing emotions by pairs using paired t-test.
The paired statistical maps are displayed in a tabular layout. Rows in the table indicate emotions calculated as positive variables in the paired t-test. Columns in the table indicate emotions calculated as negative variables in the paired t-test. A total of 10 comparisons were made from the pairwise matching between emotions. Cluster corrected results at p < 0.05 level are presented. Statistical values were transformed into Z-scores, which indicated the significance of a sensation at the group level, and then mapped on a front-posed body template.

