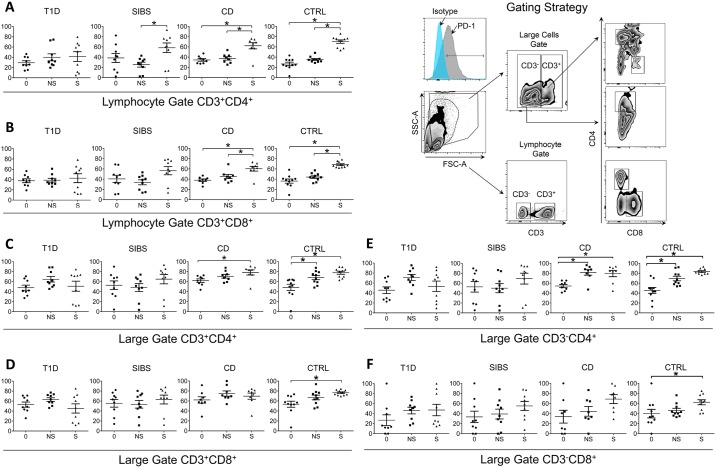
Fig 1. T Cells from T1D fail to upregulate PD-1 upon stimulation.
Freshly isolated PBMCs were stained with antibodies against CD3, CD4, CD8, and PD-1 and analyzed by flow cytometry. Lymphocytes were identified by forward and side scatter and interrogated for CD4 and CD8 expression (bottom of right panel, lymphocyte gate). Another gate with higher side scatter identified larger cells that include monocytes and activated T cells (top of right panel, large gate). Mean percentage expression of PD-1 was compared by one-way ANOVA on each of the PBMC subpopulations (A-F). Percentage PD-1 surface expression in PBMC subsets is shown, at time zero (0) and after 24 h in culture with (S) and without (NS) stimulation (* indicate p < 0.05).

