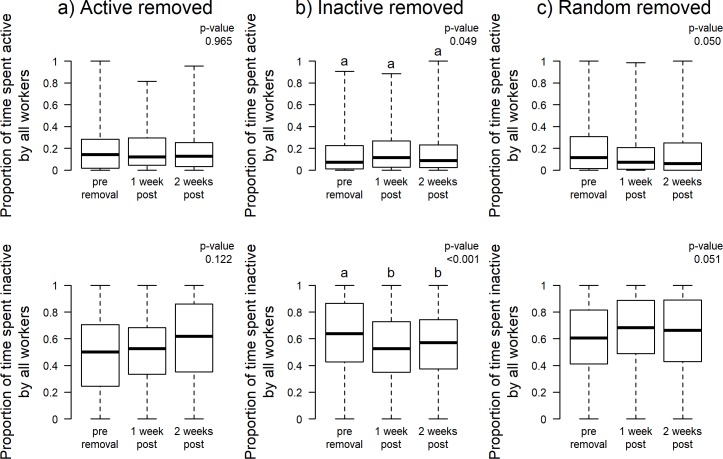
Fig 1.
Mean worker time spent active and inactive pre-removal, 1 week after removal, and 2 weeks after removal of (a) active workers (20% most inactive in each colony) (b) inactive workers (20% most inactive in each colony), and (c) randomly selected workers (20% random workers from each colony). Boxplots show median (bar), quartiles (box), and extremes (whiskers) for best illustration (all figures). *Model: LMM, fixed: Worker inactivity/activity ~ Trial, random: Colony–Contrast significance determined using Tukey post hoc tests.

