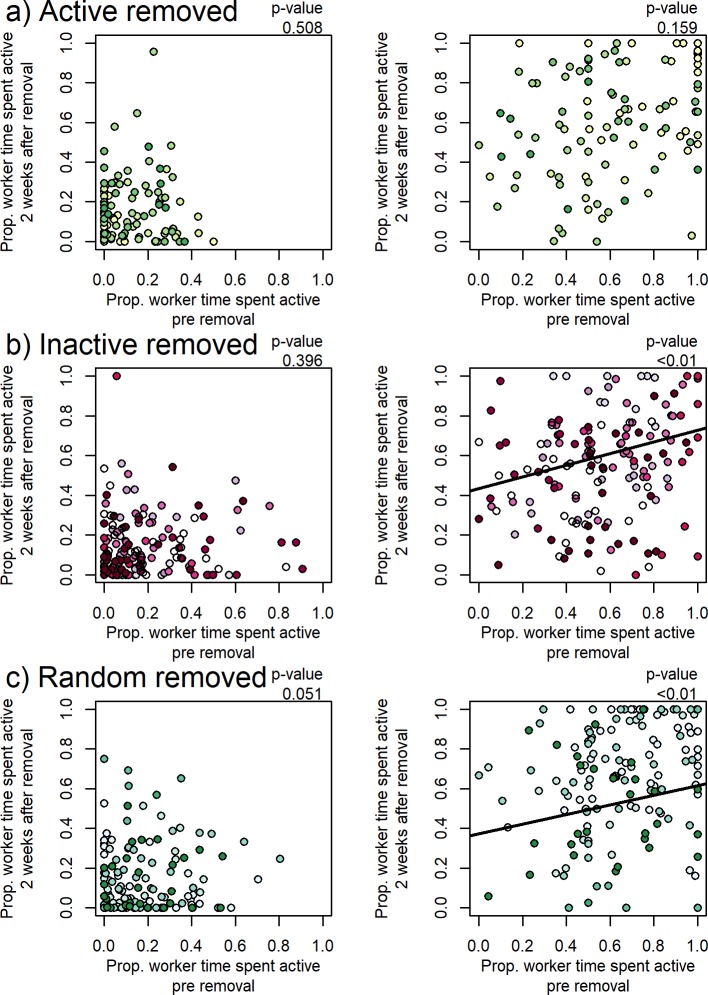
Fig 4.
a) Time spent inactive pre-removal predicts time spent inactive post-removal when ‘inactive’ and randomly selected workers are removed (b and c), but not when ‘active’ workers are removed (a). Time spent active pre-removal did not predict time spent active post-removal for any treatment (a, b and c). Colored points highlight different colonies. Marginal (variance explained by fixed effects, i.e. by time spent active/inactive pre and post removal) and Conditional (total variance explained by fixed effects and random effects, i.e. including between-colony differences) R2: a) Active Removal—Activity: Marginal R2 = 0.007, Conditional R2 = 0.120; Inactivity: Marginal R2 = 0.024, Conditional R2 = 0.231; b) Inactive Removal—Activity: Marginal R2 = 0.005, Conditional R2 = 0.130; Inactivity: Marginal R2 = 0.081, Conditional R2 = 0.337; c) Random Removal—Activity: Marginal R2 = 0.018, Conditional R2 = 0.658; Inactivity: Marginal R2 = 0.048, Conditional R2 = 0.495. *Model: LMM, fixed: Worker activity/inactivity 2 weeks post ~ Worker activity/inactivity pre, random: Colony.

