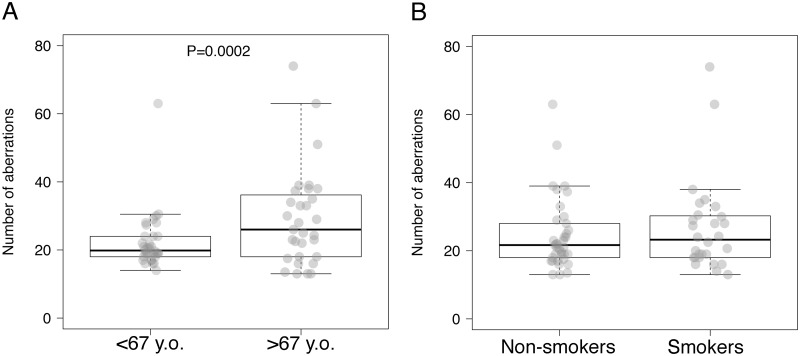
Fig 2. Mean number of genomic aberrations (MNGA) per patient and age or smoking status in oral potentially malignant disordes (OPMDs) and oral squamous cell carcinomas (OSCCs) patients.
The average number of aberrations per patient is represented as gray dots superimposed over boxes. These present a thick horizontal line indicating the median number per group, and delimitate the 25th and 75th percentile, while whiskers show the 95% confidence interval. A) average number of aberrations per patients’ age; B) average number of aberrations per patients’ smoking habit.

