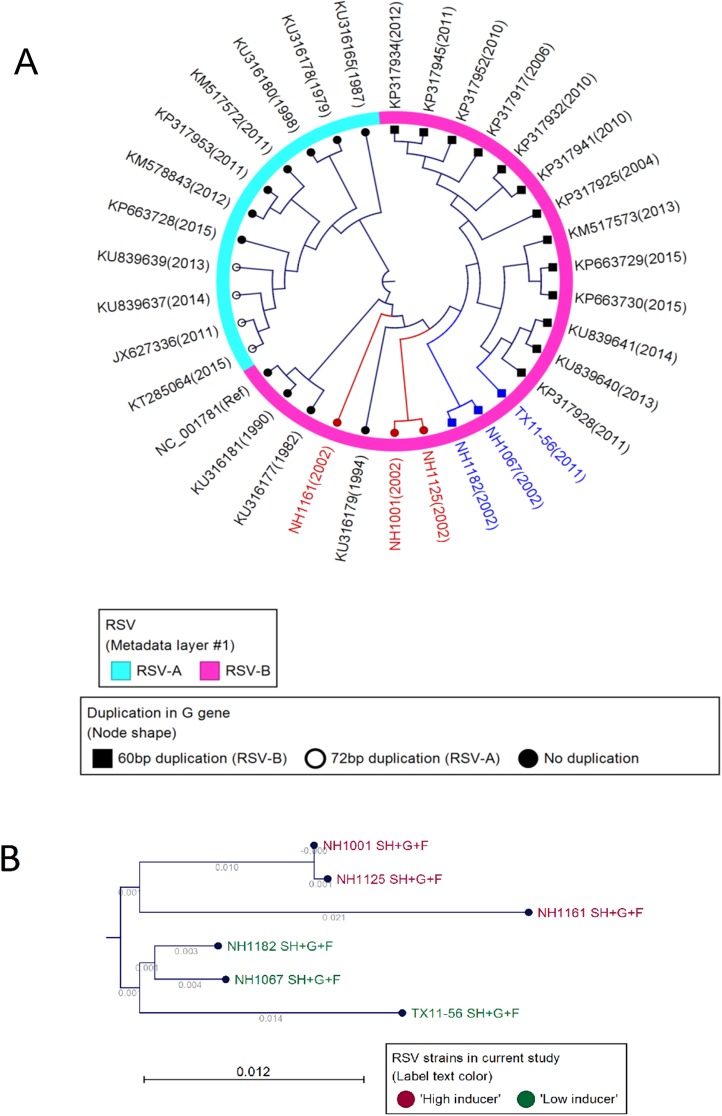
Fig 7. Phylogeny of RSV isolates and correlation to the induction phenotype within the viral genome.
(A) Phylogenetic analysis of 33 RSV A and B strains. Analysis was based on the whole genome sequence of each virus. The portion of the dendrogram circle in pink represents B strains and the portion of the dendrogram circle in light blue represents A strains. “High inducers” are in red text and “low inducers” are in blue text. (B) Phylogenic analysis based on the region of the viral genome containing the sequential genes SH, G and F. Sequence and phylogenic analysis suggested that the induction phenotype (“high” vs. “low”; see Fig 6) mapped to this region of the genome. Based on these analyses, segregation of the viral isolates correlated with the cytokine/chemokine induction phenotype.

