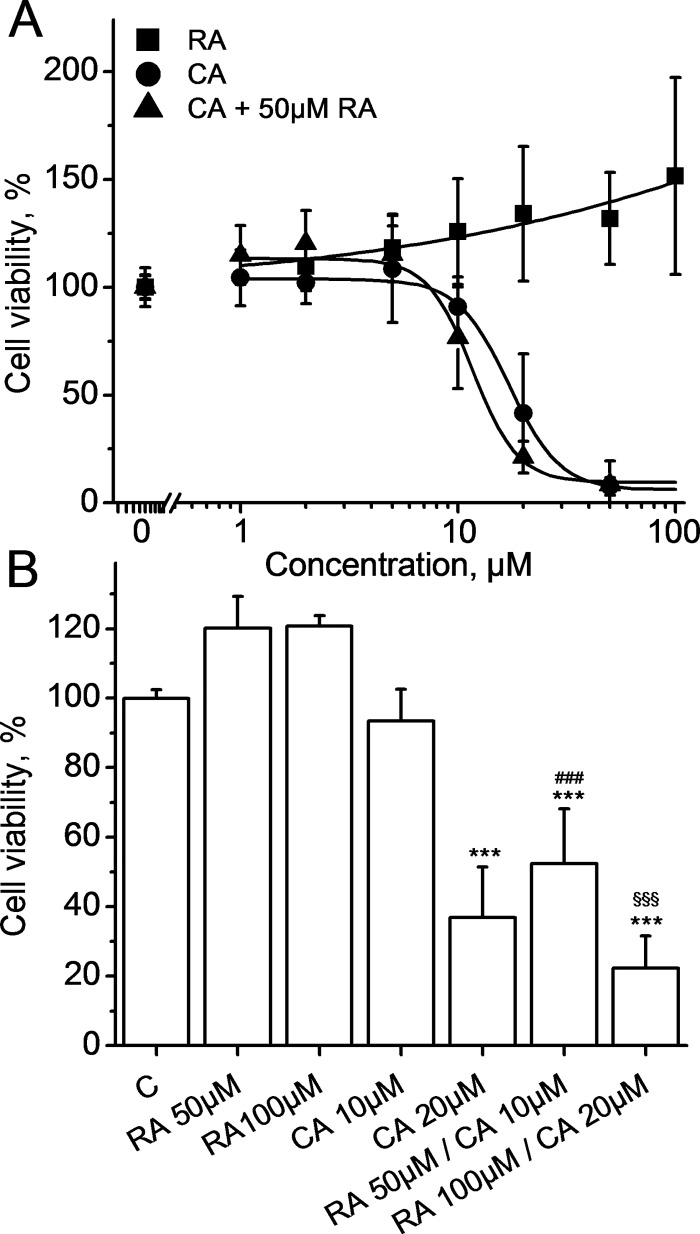
Fig 1.
A. Cell viability dose-response curves for RA alone (squares), CA alone (circles) and CA + 50 μM RA (triangles) at 24h. Data represent Mean±SD of 5 experiments for CA and RA alone and 4 experiments for RA+CA. Lines represent best fit to the logistic equation. B. Synergy of CA and RA on cellular viability at 24 h. Data represent Mean±SD of 5 experiments. Cells were treated with RA (at 50 and 100 μM), CA (at 10 and 20 μM) and RA+CA (at 50 and 10μM; 100 and 20μM, respectively). *** p< 0.001 vs C, ### p< 0.001 vs CA 10 μM, $ $ $ p< 0.001 vs CA 20 μM.

