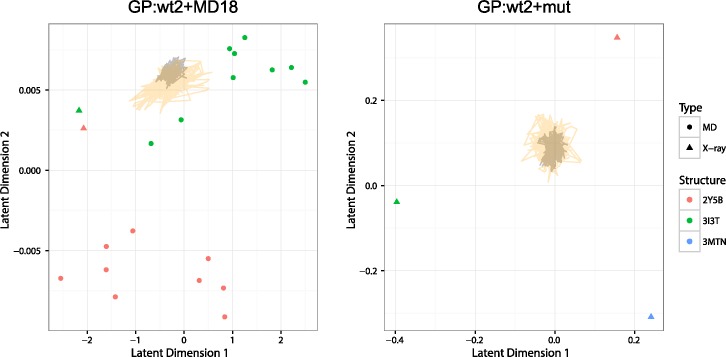
Fig 4. Latent space FlexiBaL-GP trajectory analysis.
Representative MCMC trajectories respectively operating at temperatures T = 0.10 (black lines) and T = 0.30 (orange lines) are plotted for two different inputs for the FlexiBaL-GP strategy. Input structures are shown in red, green, and blue, respectively representing structures derived from the 2Y5B, 3I3T, and 3MTN X-ray crystal structures.

