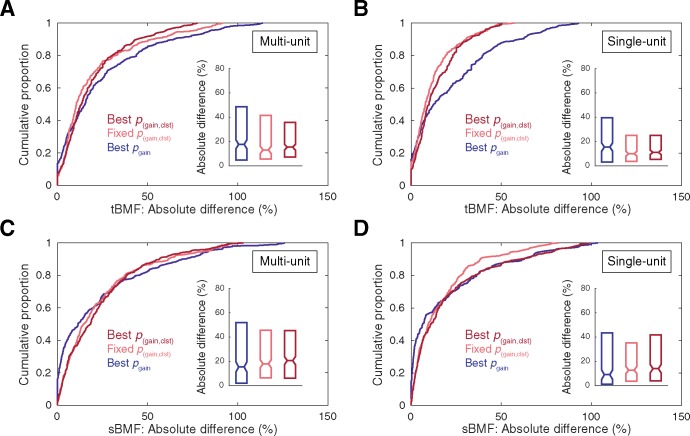
Fig 8. Summary of the consequences of statistical thresholding approaches for temporal and spectral modulation preference estimates.
Absolute percent differences in parameter estimates (relative to values obtained with the conventionally-defined significant STRF) for tBMF (A–B) and sBMF (C–D). For clarity, statistical outliers are omitted from the cumulative distribution plots (values exceeding the third quartile plus 1.5 times the inner quartile range).

