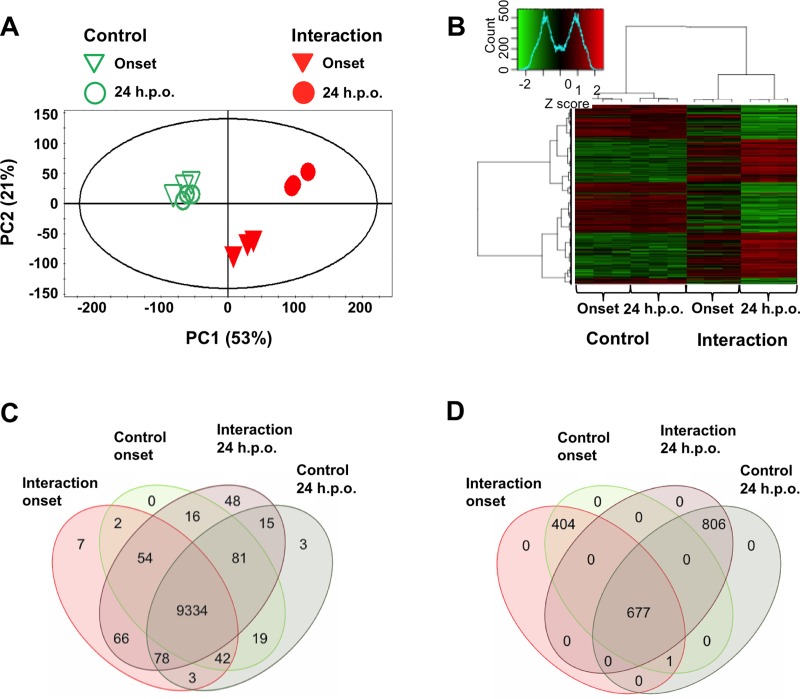
Fig 3. Overview of analysis of Rhizoctonia solani differentially expressed genes at onset and 24 h.p.o. of necrosis in soybean.
(A) PCA score plot of R. solani-soybean interactions (solid inverted triangles and circles) and controls (open inverted triangles and circles) at onset of necrosis (inverted triangles) and 24 h.p.o. of necrosis (circles). (B) Heatmap and hierarchical cluster analysis of R. solani-soybean interactions at onset and 24 h.p.o. of necrosis. Dendrograms were constructed using the Ward method [42]. (C) Venn diagram of transcriptionally active genes (at least 2 reads per sample in 2/3 biological replicates for any treatment) and the treatments in which they were detected (n = 3 per treatment). (D) Venn diagram of the 1,888 differentially expressed genes and the treatments in which they were detected (n = 3 per treatment). A number of zero indicates that no genes were found to be unique to the specific comparison.

