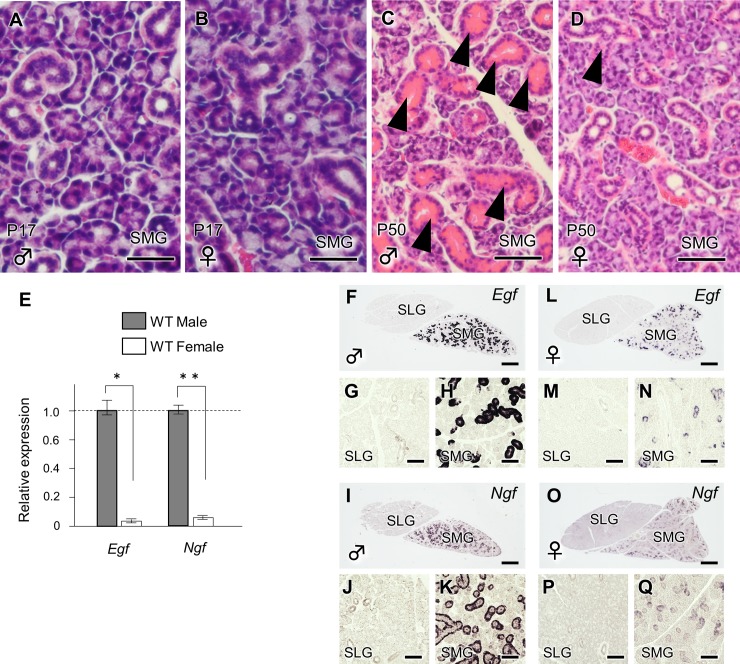
Fig 2. The evaluation of sexual dimorphism in the mouse salivary glands.
(A, B) A histological analysis was also performed to compare the male and female WT SMG on P17. Scale bars: 100 μm. (C, D) The histological evaluation of the WT SMG in males and females on P50. The arrowhead indicates the GCT. Scale bars: 100 μm. (E) Egf and the Ngf mRNA expression in male and female WT mice on P50. The quantification was normalized to GAPDH. *, and ** (F-Q) indicate statistically significant differences (P<0.05 and P<0.01, respectively) in the mRNA expression of Egf and Ngf in the WT SMG on P50 males and females. Scale bars: 500 μm. G, H, J, K, M, N, P and Q are higher magnification views of F, I, L and O, respectively. Scale bars: 100 μm.

