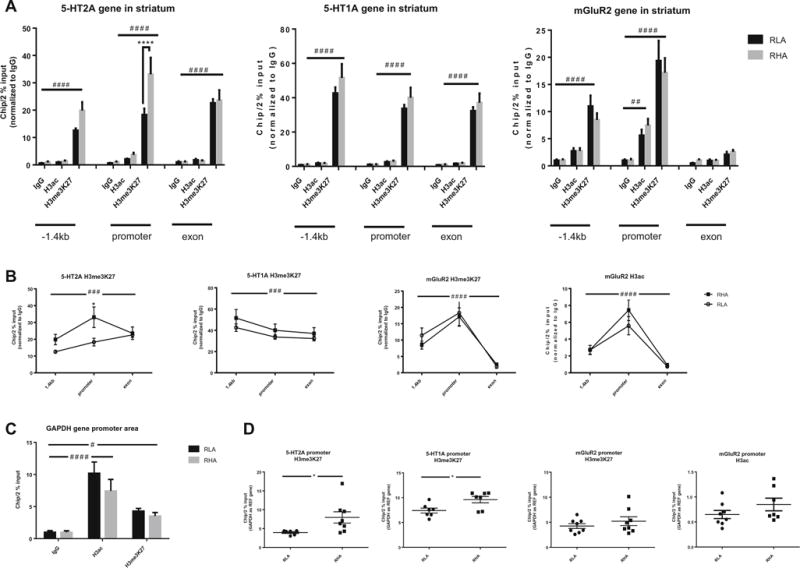
Fig. 5.

a Trimethylation of histone H3 at lysine 27 (H3me3K27) of the 5-HT2A, 5-HT1A, and mGluR2 genes at the −1.4 kb upstream, promoter, and exon 1 regions in the striatum. The mGluR2 gene showed acetylation of histone H3 in promoter region. There was no acetylation of the histone H3 in any of the regions of 5-HT2A and 5-HT1A. Post hoc analysis showed significant higher levels of H3me3K27 at the promoter region of the 5-HT2A gene in the RHA-I rats. The gene of reference GAPDH showed H3me3K27 and acetylation of H3 at the promoter region, validating the chromatin immunoprecipitation assay (c). b When comparing the different regions within the same gene for H3me3K27 levels, the promoter region peaked significantly for all three genes. In the case of the mGluR2 gene, acetylation of H3 was also significantly higher in the promoter region. For the 5-HT2A gene, there was furthermore a significant difference between the RHA-I and RLA-I strains in the promoter region. d When comparing individually the promoter region for differences in H3me3K27 levels between the two strains, significant difference was observed not only for the 5-HT2A gene but also for the 5-HT1A. No difference in H3me3K27 or H3ac levels was observed for the mGluR2 between the two strains. Two-way ANOVA, #p < 0.05, ##p < 0.01, ###p < 0.001, ####p < 0.0001; Sidack’s post hoc multiple comparison test, ****p < 0.0001; Student’s t test *p < 0.05
