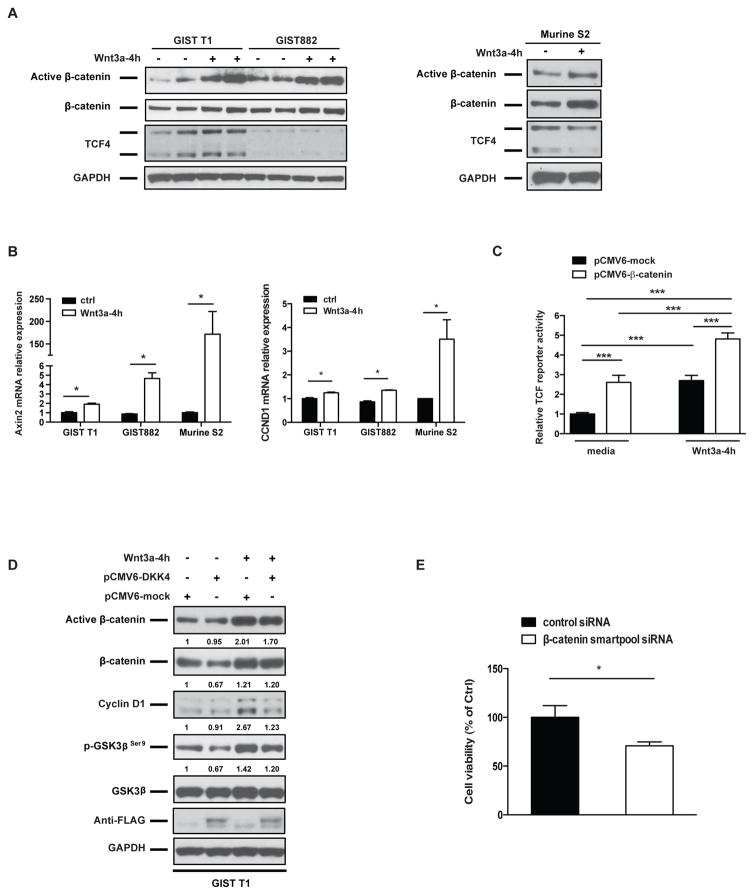
Figure 3. Wnt3a and DKK4 regulate Wnt signaling in GIST cell lines.
(A) Immunoblots of GIST T1, GIST882, and murine S2 whole cell lysates after treatment with either 150 ng/ml Wnt3a or control PBS for 4h. (B) Real-time PCR of Axin 2 and CCND1 (cyclin D1) mRNA expression after treatment with either 150 ng/ml Wnt3a or control PBS for 4h. Bars indicate means ± SEM. Student’s t test; *P < 0.05. (C) TCF/LEF reporter activity in GIST T1 cells in the presence of Wnt3a and/or β-catenin overexpression. GIST T1 cells were co-transfected with a negative reporter or TCF/LEF reporter and a mock or β-catenin expression plasmid. 48h after transfection, cells were treated with either 150 ng/ml of Wnt3a or control PBS for 4h. Relative luciferase signaling (indicating TCF/LEF activity) was determined after normalizing to renilla luciferase (indicating transfection efficiency), and expressed as relative fold changes compared to indicated control. All bars, means ± SEM. Student’s t test; *P < 0.001. (D) Immunoblots of whole-cell lysates of GIST T1 cells that had been transfected with mock or DKK4 expression plasmid and 48h later treated with either 150 ng/ml of Wnt3a or PBS for 4h. Western blot bands were quantified by Image J Software and normalized to GAPDH, and then expressed as the fold-change compared to pCMV6-mock control. (E) Cell viability assay (Dojindo) of human GIST T1 cells following 72h of transfection of control siRNA or b-catenin smartpoolsiRNA. Bars, mean ± SEM. Student’s t test; *P < 0.05.

