Summary
Glucagon-like peptide-1 (GLP-1) is a hormone with essential roles in regulating insulin secretion, carbohydrate metabolism and appetite. GLP-1 effects are mediated through binding to GLP-1R, a family B G protein-coupled receptor (GPCR) signaling primarily through the stimulatory G protein Gs. Family B GPCRs are important therapeutic targets, however our understanding of their mechanism of action is limited by the lack of structural information on activated and full-length receptors. Here we show the electron cryo-microscopy structure of the peptide-activated GLP-1R:Gs complex at near atomic resolution. The peptide is clasped between the N-terminal domain and transmembrane core of the receptor, further stabilized by extracellular loops. Conformational changes in the transmembrane domain result in a sharp kink in the middle of transmembrane helix 6, which pivots its intracellular half outward to accommodate the α5 helix of GαsRas. These results provide a structural framework for understanding family B receptor activation through hormone binding.
GLP-1 is a hormone released from the gut in response to food intake and acts on GLP-1R to stimulate glucose-dependent insulin secretion from pancreatic β cells, reduce glucagon secretion from pancreatic α cells, as well as decrease gastric motility and appetite1. Given its physiological effects, GLP-1R represents an important drug target for type-2 diabetes and obesity2, with GLP-1 and its analogs already serving as approved therapeutics.
GLP-1R is a prototypical member of the family B GPCRs3 and forms the glucagon receptor subfamily along with the glucagon receptor (GCGR), the glucagon-like peptide-2 receptor (GLP-2R), and the gastric inhibitor polypeptide receptor (GIPR). Family B receptors share common structural features including an extracellular N-terminal domain (NTD) that binds to the C-terminal half of the peptide hormone, and a 7 transmembrane domain (TMD) that binds the N-terminal half of the peptide (Fig 1a). The NTDs of family B GPCRs share a common fold stabilized by three disulfides, and contribute most of the binding affinity of the receptor for the peptide4, 5. A two-step, two-domain model of activation has been proposed where the C-terminus of the agonist peptide initially engages the NTD6. After this initial binding event, the N-terminal end of the peptide engages and activates the 7TMD with a mechanism that is currently unknown.
Figure 1. Cryo-EM structure of the hGLP-1:rGLP-1R:Gs complex.
a, Schematic of the activation of a family B GPCR by extracellular peptide agonist via a ‘two–domain’ binding mechanism. b, Views of the GLP-1R:Gs complex cryo-EM density map, colored by subunit (TM in light green, NTD in dark green, GLP-1 peptide in orange, GαsRas in gold, Gβ in light blue, Gγ in dark blue and Nb35 in grey). c, Structure of the activated GLP-1R-Gs complex in the same view and color scheme as shown in b.
To date, nine NTD structures in complex with short hormone peptides have been reported (reviewed in7), including the GLP-1R NTD bound to GLP-14. More recently, the TMD structure of GCGR8, 9 and the corticotropin-releasing factor receptor 110 in their inactive state provided the first insights into family B 7TMD configuration. However, our understanding of the Family B signal transduction mechanism remains limited, primarily due to the lack of structural information on active-state receptors that include both 7TMD and NTD in complex with peptide ligand.
GPCRs and their complexes have proven to be formidable targets for X-ray crystallography, often necessitating extensive engineering for conformational stabilization and crystallogenesis. Electron cryo-microscopy (cryo-EM) has recently emerged as a cutting-edge structure determination method, yielding structures of macromolecular complexes that have resisted intensive crystallization efforts11–13. Nevertheless, high resolution cryo-EM on asymmetric and relatively small membrane proteins (<200 kDa) remains challenging due to the low signal-to-noise ratio that hampers the accuracy of angular determination for 3D reconstructions. This problem is compounded by the intrinsically dynamic character of the 7TM bundle14, 15 and the relative instability of GPCR complexes, such as with G proteins16 or arrestins17, often resulting in conformational variability or even dissociation during cryo-EM specimen preparation. Notwithstanding these challenges, cryo-EM visualization for GPCR complexes holds tremendous potential for uncovering the various molecular mechanisms involved in signal transduction and regulation of GPCRs and their effector proteins. Here, we applied single-particle cryo-EM to determine the structure of the 150kDa complex between the active-state GLP-1R and heterotrimeric G protein Gs, obtaining insights into family B GPCR activation.
Cryo-EM structure determination of the GLP-1:GLP-1R:Gs complex
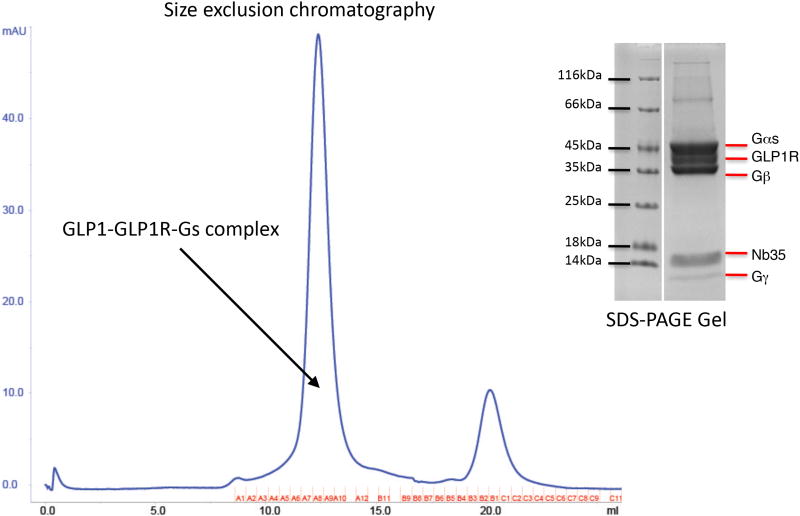
For cryo-EM studies we used rabbit GLP-1R, which shares 92% identity with the human receptor, as it expressed at higher levels in insect cells than the human or mouse homologue. GLP-1R is very unstable to extraction from membranes using conventional detergents such as DDM and MNG; therefore, we formed the complex between receptor and purified Gs in insect cell membranes prior to extraction of the GLP-1R:Gs complex with MNG and purification by antibody affinity and size exclusion chromatography (Fig. S1).
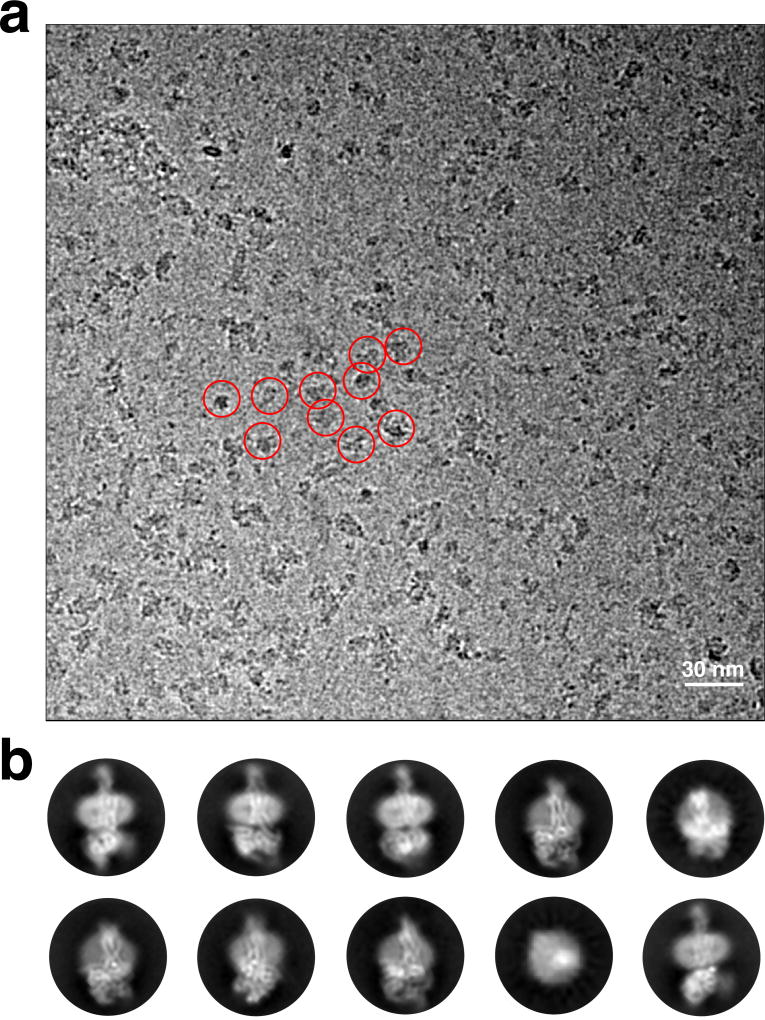
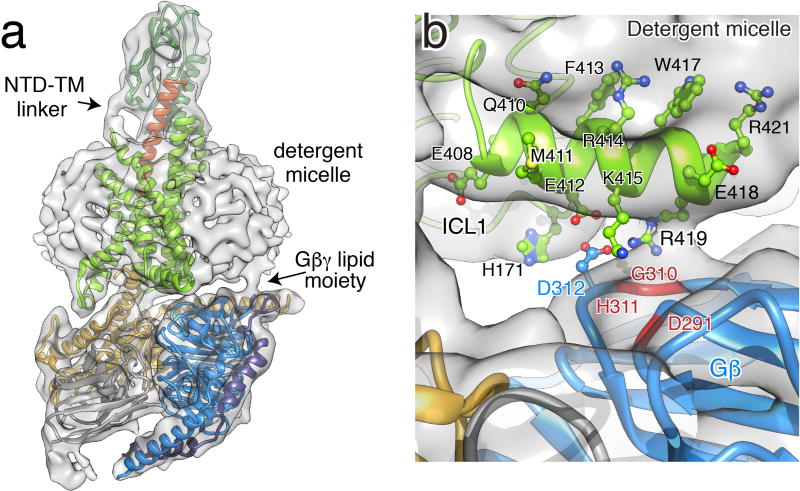
Sample evaluation by negative stain EM and single-particle averaging18 confirmed a monodisperse particle population and stable complex formation. Initial cryo-EM experiments suggested that the protein complex avoided areas of thin vitreous ice, and we thus had to image the specimen in relatively thick ice at the expense of increased background noise in the micrographs (Fig. S2a). Nevertheless, 2D classification revealed class averages with clear secondary structure features for the complex, including the GLP-1R 7TM region embedded in detergent micelle (Fig. S2b). Subsequent 3D classification led to the identification of a particle partition showing well defined and stable features for the complex, apart from the α-helical (AH) domain of Gαs whose density was averaged out (Fig. S3). This is in agreement with our previous studies showing that the AH domain gets delocalized from the GαsRas domain and becomes flexible in the absence of nucleotide19. Refinement and reconstruction of the selected particle projections after subtracting densities for the detergent micelle and the mobile AH domain enabled us to obtain a 3D reconstruction of the complex at 4.1-Å global resolution, with 3.9-Å nominal resolution in the core region that includes GLP-1, TMD and the α5 helix of GαsRas (Fig. 1b,c and S3–5). The cryo-EM map shows a stable and well defined density for the GLP-1 peptide that is observed between the receptor NTD and the hydrophobic core of the 7TM region. In addition, the linker connecting the NTD to the 7TM region is clearly visible in reconstructions obtained without applying micelle masking, where we also observe the lipid moiety of Gβγ inserted in the MNG detergent micelle (Fig. S6a,b).
Using the cryo-EM density map we built and refined a near atomic resolution structure of the GLP-1:GLP-1R:Gs complex. Side chains of primarily bulky amino acid residues are clearly identifiable in most transmembrane helices that appear to assume overall stable positions (Fig. S5). The only exception is the cytoplasmic half of TM6, whose density is less well defined compared to the other TMs, suggesting that this part becomes dynamic in the activated GLP-1R. The GLP-1 peptide is well resolved, particularly in its N-terminal half that maintains interactions with the TM core. This is also the case for the α5 helix of Gαs, the C-terminal part of which is stably interacting with the cytoplasmic part of GLP-1R. In addition, the map includes densities for all intracellular and extracellular receptor loops (ECLs). Thus, we could resolve several key interactions of GLP-1R with GLP-1 and heterotrimeric Gs.
GLP-1 recognition by GLP-1R
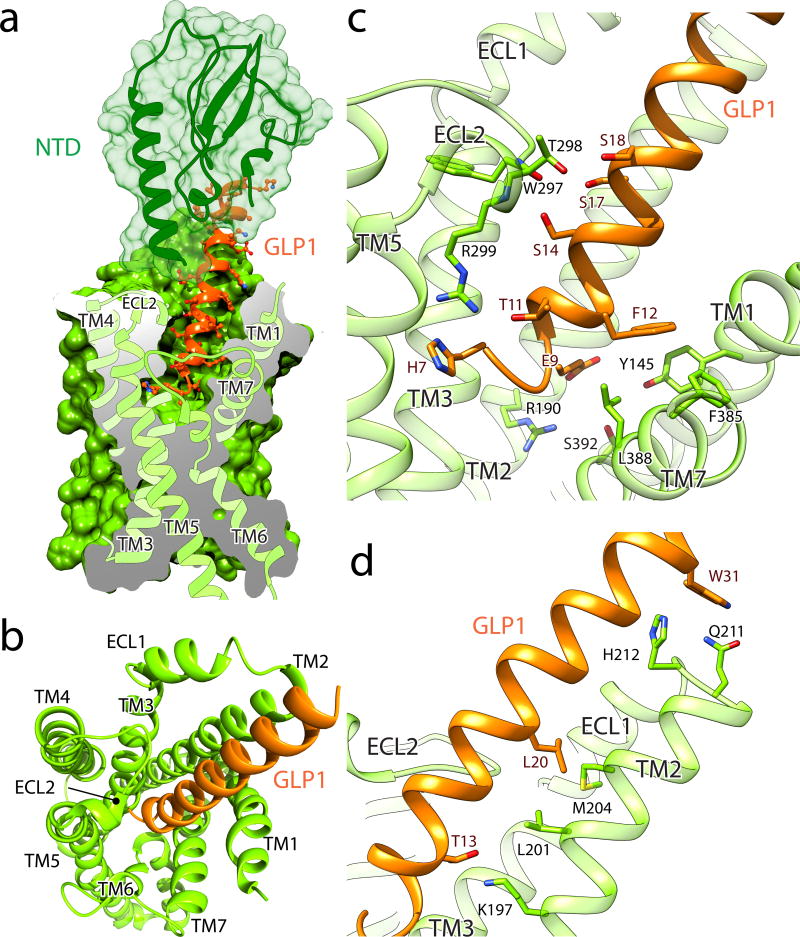
The activated GLP-1R structure shows that the GLP-1 peptide is stably anchored in its position through an extensive network of interactions that involves TMs 1,2,5,7, ECLs 1 and 2, as well as the NTD (Fig. 2, Fig. S7). Even though the cryo-EM map is limited in resolution, the α-helical nature of the peptide and the stability of its position have allowed us to confidently establish its main interactions with the receptor. The majority of these observations, summarized in Supplementary Table S1, are confirmed through extensive mutagenesis studies on GLP1-R and other Family B GPCRs20–31.
Figure 2. The orthosteric peptide binding pocket of GLP-1R.
a, Cutaway view showing GLP-1 (ribbon and atom in ball and stick, orange) penetration into a pocket formed by TMs 1, 2, 5, 7, ECL1 and 2 (ribbon and surface, light green) while its C-terminal part is recognized by the NTD (ribbon in transparent surface, dark green). b, View from the extracellular side of the orthosteric peptide binding pocket in the receptor bundle with omitted NTD. c–d, Close-up views of the interaction between the receptor and its endogenous agonist GLP-1.
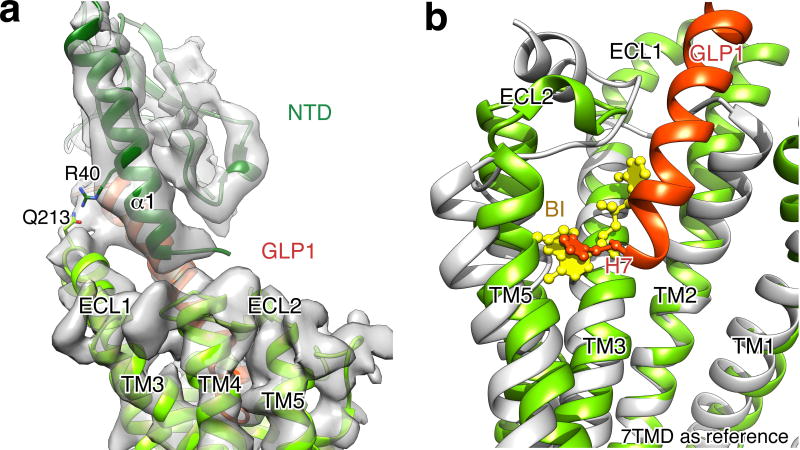
The interface between the C-terminal half of the peptide hormone and NTD appears identical to the one in the crystal structure of NTD:GLP-1 (Fig. S8). Of interest, the cryo-EM map suggests that the NTD is not in contact with the 7TM region, although based on our refined structure we raise the possibility of Gln213 of ECL1 interacting with Arg40 located in the α1-helix of the extracellular domain (Fig. S9a). Given that TM1 and NTD are separated by a flexible linker sequence, the lack of direct interactions implies that in the absence of ligand the extracellular domain is flexible, which is likely important for the initial engagement of the peptide32.
For some Family B members, the binding of the peptide to the TM core may stabilize the formation of an α-helix at the N-terminus, which can then activate the receptor33. Consistent with this, the cryo-EM structure reveals that the N-terminus of GLP-1 forms at least one additional helical turn in the core of the receptor compared to its structure when bound only to the NTD4. Thus, the N-terminus of GLP-1 penetrates into the receptor core (Fig. 2a) to a depth comparable to the orthosteric agonist BI-167107 in the structure of activated β2AR16, a family A GPCR (Fig. S9b). An important interaction in this region is mediated by conserved H7P, which is in position to establish hydrogen bonding with R299 (Fig. 2b,c). This Arginine resides in ECL2, and thus the long side chain points down towards the receptor core in order to reach close to the peptide N-terminus (Fig. S7). Another significant contact at the N-terminus of the peptide is mediated through E9P that participates in van der Waals interactions with Leu388 and Ser392 of TM7, while it is also positioned to potentially form hydrogen bonding with conserved polar residues R190 on TM2 and Y145 on TM1 (Fig. 2c). Position 190 is highly conserved, with strict occupancy by Arg or Lys, as is also the case for K197 (GCGR is exception) that is hydrogen bonded to T13P in GLP-1 (Fig. 2d).
Moving away from the peptide N-terminus, notable interactions with GLP-1R involve ECLs 1 and 2. A cluster of neighboring serines (S14p, S17p, S18p) forms polar interactions with T298 and the backbone oxygen of W297 and nitrogen of R299 on ECL2 (Fig. 2c). Thus, ECL2 plays a prominent role in GLP-1 binding, in agreement with previous studies20, 21, 28. Towards the peptide C-terminus, we observe W31p interacting with ECL1, packing against residues Q211 and H212 (Fig. 2d). ECL1 has been implicated in peptide binding based on hydrogen-deuterium exchange experiments and MD simulations with GCGR32, as well as alanine scanning mutagenesis on the calcitonin receptor-like receptor31. We also note that the prominent interactions involving ECLs 1 and 2 with residues past the N-terminal region of the hormone may explain the partial agonist activity of shorter peptide fragments, such as GLP-1(15–36)34.
Comparison with inactive family B receptors
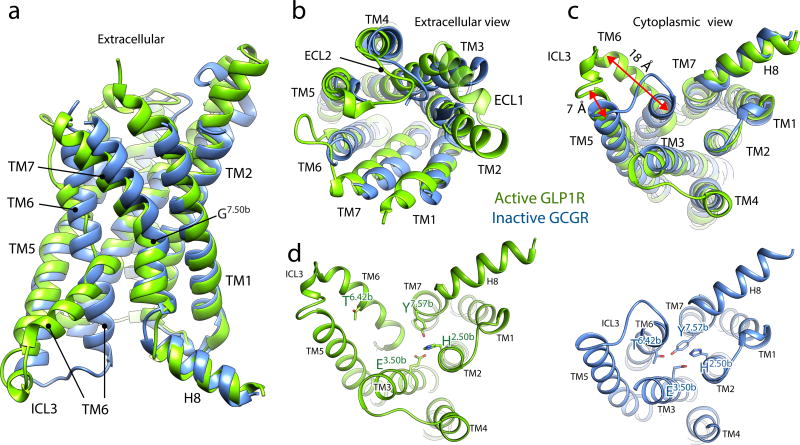
GLP-1R and GCGR share an overall 44% sequence homology that extends to 55% for the TMDs. We thus chose the crystal structure of GCGR in complex with antagonist8 as a reference to examine the structural changes associated with family B GPCR activation. Comparison between activated GLP-1R and inactive GCGR reveals that the TM bundle undergoes extensive conformational transitions induced by the multiple peptide-receptor interactions (Fig. 2). In the extracellular half of the receptor, TM7 bends towards TM6 using as pivot point the kink at G3957.50b (Wooten numbering in superscript25) (Fig. 3a), equivalent to the conserved G7.42 (Ballesteros-Weinstein numbering for family A GPCRs in superscript35) in family A GPCRs36. In the inactive family B GPCR structures, the extracellular halves of TM6 and TM7, including ECL3, exhibit high crystallographic temperature factors indicating structural flexibility. In the active GLP-1R complex, the extracellular half of TM6 unwinds and moves outwards to allow interactions between the peptide amino terminus and the TMD binding pocket. The extracellular half of TM1 follows the movement of TM7, dictated by the hydrogen bond between highly conserved S1551.50b and the backbone of L3967.51b, which was found to stabilize the kink in TM7 in both apo and inactive family B GPCRs8–10. In addition, more limited changes are observed in the extracellular halves of TM3, TM4, and TM5, which appear to move in tandem with the same orientation in response to peptide binding (Fig. 3b). Interestingly, the extracellular end of TM2 is extended by 10 residues in activated GLP-1R compared to inactive GCGR (Fig. 3a–b). This α-helical extension elevates the position of ECL1, which is ordered against the C-terminal half of the peptide, in contrast to its apparent disorder in all available family B GPCR structures8–10. Consistent with this observation, hydrogen/deuterium exchange studies and MD simulations also indicate the peptide binding event stabilizes the conformation of ECL1 in the glucagon-GCGR complex32.
Figure 3. Comparison of active-state GLP-1R with inactive GCGR.
Side (a), extracellular (b) and cytoplasmic (c) views of the activated GLP-1R TM bundle (light green) in superposition to the inactive glucagon receptor bound to allosteric antagonist (not shown; PDB code: 5EE7, blue). Significant conformational changes are observed on the cytoplasmic face of TM5 and TM6. TM6 moves outwards by 18 Å as measured at the α-carbon of Lys346, while TM5 moves a smaller distance by 7 Å when measured at the α-carbon of Lys334. A notable difference on the extracellular side is TM2 extended by three helical turns stabilized by peptide ligand binding. The disordered extracellular loops (ECLs) in the inactive GCGR structure are stabilized and structurally ordered in the activated GLP-1R structure. d, Comparison of HETx motif networking (in stick, Wootten numbering in superscript) between inactive GCGR and active GLP-1R shows that the outwards movement of TM6 removes T6.42b from the polar network.
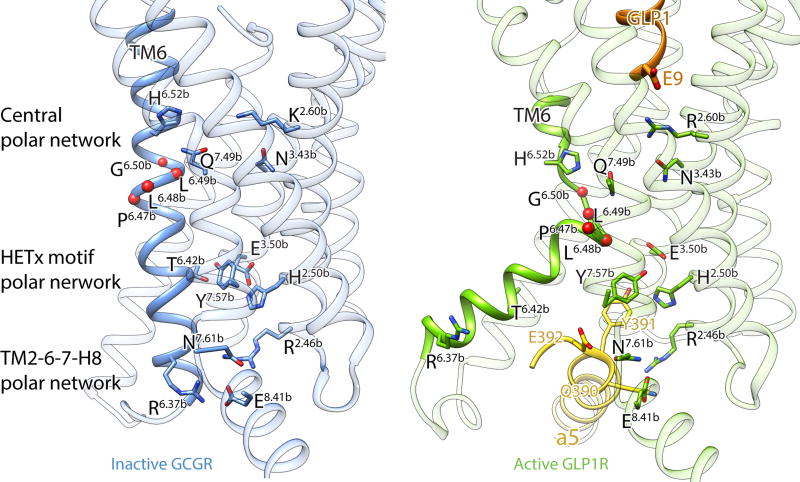
In the intracellular half of the receptor we observe a remarkable agreement in the positions of TM1-4 and TM7 between the inactive GCGR and active GLP-1R (Fig. 3c). The most profound structural difference is the sharp kink in the middle of TM6, which pivots its intracellular half to move outwards by ~18 Å when measured at the Cα carbon of K3466.35b. The TM6 kink locates in the Pro6.47b-Leu-Leu-Gly6.50p sequence, representing the PXXG motif that is conserved throughout the mammalian family B receptors, with the proline playing a key role in receptor activation37, 38. The presence of proline and glycine, having poor helix-forming propensities, make this motif flexible and susceptible to unwinding, which is required for signal transduction through the 7TM bundle. A smaller outwards movement of ~7 Å is observed for the cytoplasmic end of TM5 as it repositions to facilitate the outward opening of TM6. As a result of the TM6 outward movement, the polar interaction network involving H2.50b, E3.50b, T6.42b and Y7.57b is disrupted (Fig. 3d). The HETx motif is highly conserved in family B members and is equivalent to the conserved E/DRY motif in family A GPCRs, whose interactions have also been shown to stabilize the inactive state39. Accordingly, mutation of HETx motif residues results in constitutive activation of many family B GPCRs40, 41.
Interactions between activated GLP-1R and Gs
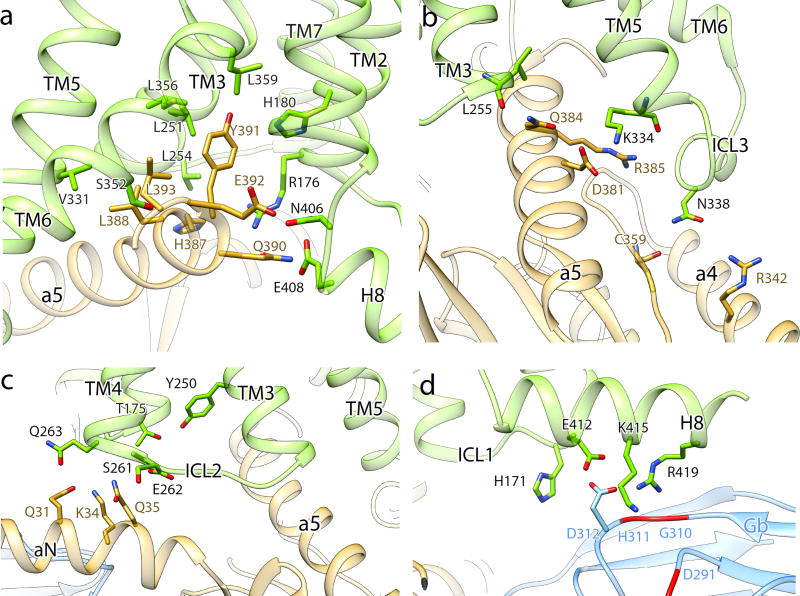
The 18-Å outwards opening of the cytoplasmic half of TM6 and more limited associated movement of TM5 forms a cavity together with TM2-3 and TM7 that serves as the main binding site for the GαsRas domain of heterotrimeric Gs (Fig. 4a–b). Compared to the β2AR-Gs crystal structure16, the interface of Gs with GLP-1R additionally involves direct interactions of Gβ with ICL1 and α-helix H8, which is tilted towards the G protein (Fig. 4c–d, Fig. S6b). The connection between H8-helix and Gβ is clearly visible in maps generated without masking the detergent micelle, revealing that R419 of H8 is in close proximity to the 310–311 backbone of Gβ (Fig. S6b). Furthermore, the structure suggests that additional electrostatic contacts may be present between E412 of H8 and H171 of ICL1 with D312 of Gβ, K415 of H8 and D291 backbone of Gβ (Fig. 4d). In contrast to its G protein proximal face that displays polar residues, the membrane proximal face of H8 includes conserved bulky aromatic residues, consistent with our observation that this helix is found buried in the detergent micelle of the GLP-1:GLP-1R:Gs complex (Fig. S6b). We thus conclude that H8 is in close contact with the membrane, which may enhance receptor stabilization in the lipid bilayer.
Figure 4. GLP-1R interactions with Gs.
a–b, The GαsRas α5-helix docks into a cavity on the intracellular side of the receptor TM bundle formed by the opening of TM helices 5 and 6. a, Gs interactions with the transmembrane core include polar and non-polar contacts. The recognition of Y391 of the α5-helix involves both a small hydrophobic pocket formed by L251, L356 and L359, and potential hydrogen bonding with H180 of the conserved polar network, equivalent to the E/DRY motif in family A GPCRs. b, Q384 and R385 of the α5-helix form a polar interaction network with the cytoplasmic ends of TM3 and TM5, respectively. N338 of ICL3 is in close proximity to R342 of α4-helix and C359 of β4-strand. c, Y250 of TM3 and T175 of TM2 form a hydrogen bond constraining the conformation of ICL1 and ICL2 with respect to each other. E262 and Q263 at the intracellular tip of TM4 and S261 of ICL2 form polar interactions with the stretch Q31-Q35 of αN-helix. d, H171 of ICL1 participates in the electrostatic interaction network between E412, K415 and R419 of H8 with D312 and D291 of Gβ (see also Figure S6b).
The GLP-1R:GαsRas interface is primarily stabilized by both hydrophobic and polar interactions involving TM2, TM3-4, TM5–6 and the TM7-H8 junction of the receptor with α4-helix, α5-helix, αN-helix, and the beginning of β6-strand of GαsRas (Fig. 4). The carboxyl terminal GαsRas α5-helix overlaps the position of the cytoplasmic end of TM6 in the inactive state, explaining the requirement for TM6 opening in order to accommodate the G protein. The conformational transition of TM6 results in breaking up the highly conserved polar network within TM2-6-7-H842, thereby releasing R176 in TM2, N406 and E408 in the TM7-H8 junction. The cryo-EM density map suggests that these residues may be stabilized again in the GLP-1R:Gs complex through electrostatic interactions or hydrogen bonds with Q390 and E392 of the Gαs α5-helix (Fig. 4a).
Comparison with activated family A GPRCs
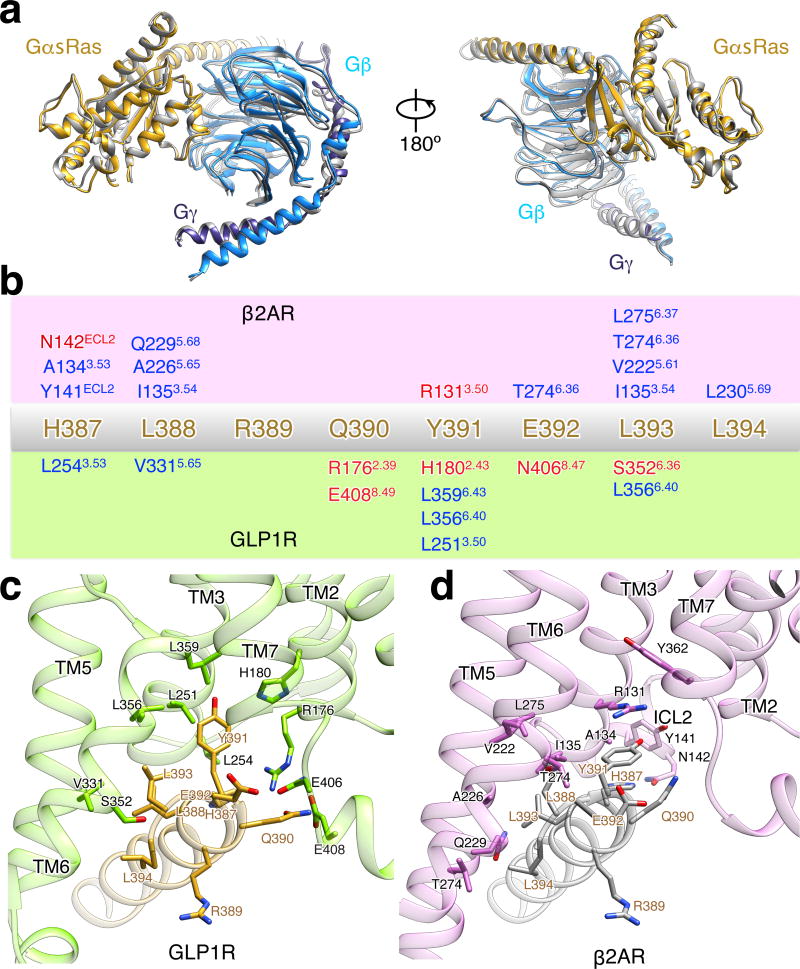
The only available structure of a GPCR:G protein complex to date is from the complex of heterotrimeric Gs with activated β2AR, a family A GPCR16. Structural superposition of GLP-1R:Gs with β2AR:Gs reveals that the G protein conformation is almost identical (Fig. S10a). The overall root mean square deviation in Gas between the two complexes is approximately 1.0 Å, with the main differences located adjacent to the AH domain that becomes delocalized in the absence of nucleotide in Gαs19. Gβγ in the GLP-1R:Gs structure positions closer to the receptor by ~2 Å, a spatial proximity facilitated through the interaction between H8-helix and Gβ.
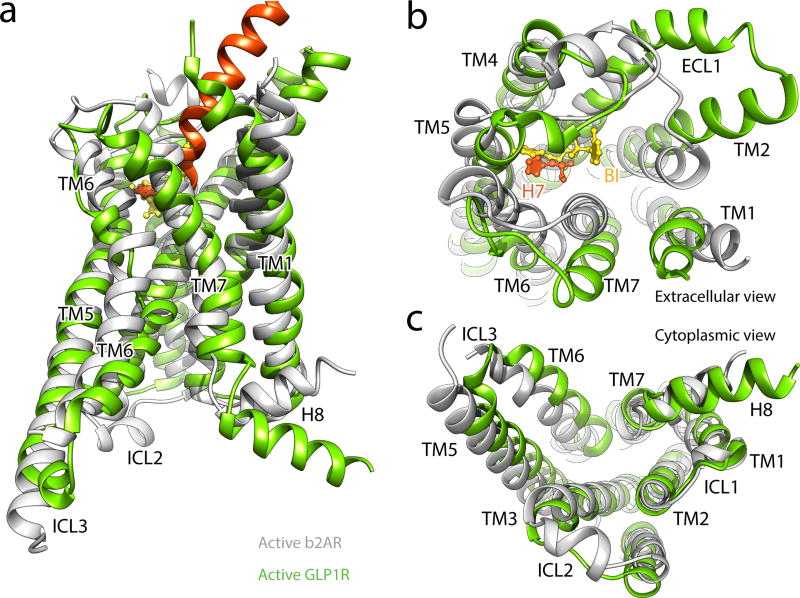
Superposition of the TMDs in both G protein complexes shows that active GLP-1R and β2AR share similar folds in regards to the global conformation of the 7TM helices (Fig. 5a). One notable difference is the significantly longer α-helical extensions of TM2, resulting in the elevation of ECL1 that engages the C-terminal half of the peptide. Viewing towards the membrane plane from the extracellular side, we observe divergence in the position of the α-helical tips of all TMs apart from TM3 and TM4 (Fig. 5b). This divergence primarily reflects the differences in the type of ligand engaging the receptor, with the larger peptide ligand requiring additional space for accommodation by the transmembrane bundle.
Figure 5. Comparison between activated family A and B receptor conformations.
Side (a), extracellular (b), and cytoplasmic (c) views of the activated GLP-1R TM bundle (TM in light green, endogenous agonist peptide GLP-1 in orange) superpositioned with the active β2AR (grey) bound to allosteric antagonist BI-167107 (yellow) (PDB code: 3SN6), related to Figure S9.
In contrast to the extracellular half, the TMs at the cytoplasmic half of activated GLP-1R and β2AR assume similar topology (Fig. 5c). Despite the sharp kink and unwinding in the middle of TM6 of GLP-1R compared to its preserved helicity in β2AR, the cytoplasmic ends reach the same position. Thus, both GLP-1R and β2AR form a similar cavity recognizing the C-terminal GαsRas α5-helix, consistent with the fact that for both receptors the interactions with the α5-helix are primarily non-polar and also involve some position equivalent residues, e.g. X3.50, X3.53, X5.65 and X6.36 (Fig. S10b–c). It is notable however, that even though the overall structural landscape is very similar, the molecular details of the recognition pattern on the receptor are very different between β2AR and GLP-1R (Fig. S10b–c). This observation also highlights some flexibility in the configuration of the GαsRas α5-helix, enabling it to form diverse interactions through the same set of C-terminal amino acids.
Implications for family B GPCR activation
The cryo-EM structure of the activated GLP-1R:Gs complex facilitates the integration of a large body of biochemical and biophysical data towards understanding the activation of family B GPCRs through peptide binding. Current evidence suggests that in the absence of ligand the NTD is mobile through flexibility in the linker connecting it to TM132, thereby increasing the probability of the initial recruiting interactions with the C-terminal region of the peptide. After an initial, high-affinity recruitment by the NTD, the captured peptide engages the 7TM region, with its N-terminal region establishing interactions with the transmembrane core. The structure shows that GLP-1 binding destabilizes the helicity of TM6 with simultaneous rearrangements in the central polar network of the TM bundle (Fig. 6). This network facilitates the stabilization of the TM core and is positioned to detect peptide binding through potential interactions of R2.60b (K2.60b in GCGR) with residue E9 at the peptide N-terminus. The middle of TM6 includes the helically unstable Pro6.47b-X-X-Gly6.50p motif, which appears to unravel as a consequence of TM7 bending due to steric hindrance with the bound peptide. While the resolution of the cryo-EM map does not allow us to clearly resolve the interactions in this region, our model suggests that the exposure of the carbonyl oxygens in the backbone of Pro6.47b-Leu-Leu6.49b enables interactions with polar residues in TM3,5,7 that stabilize the outwards opening of the cytoplasmic half of TM6. The rearrangement of TM6 subsequently breaks apart polar interactions of the conserved HETx and TM2-6-7-H8 network, thereby creating a cavity and releasing residues that engage the α5-helix of GαsRas. Thus, peptide binding at the extracellular surface is communicated to the intracellular receptor side and results in G protein engagement and activation.
Figure 6. Polar network rearrangements upon GLP-1R activation.
Comparison of polar network arrangements in the inactive-state GCGR (PDB code: 5EE7; the coordinates for residue R2.46b were obtained from the crystal structure of apo-state GCGR) and active-state GLP-1R. GLP-1 binding results in the cytoplasmic half of TM6 outward movement with simultaneous rearrangements of the central polar network. The rearrangement of TM6 breaks apart polar interactions of the conserved HETx and TM2-6-7-H8 networks, releasing residues for interactions with the GαsRas α5-helix. Peptide ligand GLP-1, TM6 and GαsRas α5-helix are shown in ribbon and colored as previously. Polar network residues are shown in stick with Wootten numbering in superscript. The exposed backbone carbonyl oxygens of Pro6.47b-Leu-Leu-Gly6.50p are shown as red spheres.
Despite the diversity between family A and B GPCRs, we observe that both receptor types converge topologically in the cytoplasmic side. This structural similarity near the G protein coupling sites reflects a convergence of activation pathways, which has been highlighted in family A GPCRs43, and enables this large family of receptors to bind and get activated by very diverse ligands, but signal intracellularly via a small common repertoire of G proteins. While further work is needed to provide a detailed picture of activation pathways in different GPCR classes, we anticipate that the application of the rapidly evolving cryo-EM technologies will transform structural studies of these challenging proteins.
Methods
Construct and expression of GLP-1R
The mature version of Oryctolagus cuniculus GLP-1R, starting at Arg24, was cloned into pFastBac vector with its C-terminus truncated at Leu422. To facilitate expression and purification, an N-terminal FLAG epitope, and a 3C protease site were inserted after HA signal peptide. These constructs were expressed in Sf9 insect cells using the Bac-to-Bac baculovirus system (Invitrogen). The cells were infected with baculovirus at 27 °C for 48 h before collection.
Construct, expression and purification of Gs heterotrimer and Nb35
Gs heterotrimer was expressed in HighFive insect cells (Invitrogen). Human Gαs was cloned in pVL1392 vector, and the virus was prepared using BestBac system (Expression Systems, LLC). N-terminal His6-tagged rat Gβ1, and bovine Gγ2 were cloned into pFastBac vector, and the virus was prepared using Bac-to-Bac baculovirus system. The cells were infected with both Gαs and Gβγ virus at a ratio determined by small-scale titration experiment at 27 °C for 48 h before collection. Gs heterotrimer was purified as previously described16. Nanobody-35 (Nb35) was expressed in the periplasm of E. coli strain WK6, extracted, and purified by nickel affinity chromatography according to previously described methods16.
GLP-1R:Gs:Nb35 complex formation and purification
Sf9 cell pellets infected with virus containing GLP-1R were lysed in 10 mM Tris, pH7.6, 1 mM EDTA, 4 mg/ml Iodoacetimide, 2.5 mg/ml Leupeptin, 0.16 mg/ml Benzamidine. The sample was centrifuged at 200g for 7 minutes to get rid of un-disrupted cells and large cell debris such as nuclei. The supernatant was then centrifuged at 37,800g for 25 minutes to collect the membranes. The membranes were washed by homogenization in 30mM Hepes, pH 7.5, 150mM NaCl, 100uM TCEP, 2.5 mg/ml Leupeptin, 0.16 mg/ml Benzamidine then collected by centrifugation at 37,800g for 25 minutes.
The GLP-1R:Gs complex was formed in membranes. The washed membranes were homogenized in 30mM Hepes, pH 7.5, 150mM NaCl, 100uM TCEP, 2.5 mg/ml Leupeptin, 0.16 mg/ml Benzamidine. For every 6 Liters of GLP-1R cell pellets, 10mg of Gs and 2mg of Nb35 were added, along with 1mM MnCl2, 10mM MgCl2, 10uM GLP-1 peptide, 4,000 units λ-phosphatase, and 1 unit Apyrase. The sample was mixed overnight at 4 °C. The membrane sample with GLP-1R:Gs:Nb35 complex formed was collected by centrifugation at 37,800g, and then solubilized by in a buffer comprised of 1% DDM, 0.5% CHAPS, 0.2% Cholesteryl hemisuccinate (CHS), 30 mM Hepes, pH 7.8, 150 mM NaCl, 30% glycerol, 25uM TCEP, 2.5 mg/ml Leupeptin, 0.16 mg/ml Benzamidine, and 1uM GLP-1. After 1 hour of solubilization, the sample was centrifuged at 37,800g to remove the insoluble debris. The supernatant was diluted 2-fold by adding the same volume of buffer without DDM, CHAPS and CHS. Then anti-FLAG M1 affinity resin was added and CaCl2 were added to final concentration of 2.5mM. After 2 hours of mixing, the M1 resin was collected by centrifugation at 200g and loaded into a column, and was extensively washed by FLAG-wash buffer (30mM Hepes, pH7.5, 500mM NaCl, 10% v/v glycerol, 2.5mM CaCl2, 1uM GLP-1, 25uM TCEP, 0.1%DDM, 0.125%CHAPS, 0.02%CHS). The buffer was exchanged to 30mM Hepes, pH7.5, 150mM NaCl, 2.5mM CaCl2, 1uM GLP-1, 25uM TCEP, 0.25% Lauryl Maltose Neopentyl Glycol (MNG, NG310 Anatrace), 0.25% GDN (GDN101, Anatrace), 0.048% 1-palmitoyl-2-oleoyl-sn-glycero-3-phospho-1'-rac-glycerol (POPG, Avanti), and 0.03% cholesterol (Sigma-Aldrich), in a step-wise manner, over a period of at least 1 hour. The complex sample was eluted from anti-FLAG column by FLAG elution buffer, 30mM Hepes, pH7.5, 150mM NaCl, 5mM EDTA, 200uM FLAG peptide, 1uM GLP-1, 25uM TCEP, 0.01% MNG, 0.01% GDN, 0.00192% POPG, 0.0012% cholesterol. 3C protease and PNGaseF (New England Biolabs) was then added. After deglycosylation and digestion, the GLP-1R-Gs-Nb35 complex sample was concentrated and loaded onto Superdex S200 10/300 GL column with running buffer 30mM Hepes, pH7.5, 150mM NaCl, 1uM GLP-1, 100uM TCEP, 0.01% MNG, 0.01% GDN, 0.00192% POPG, 0.0012% cholesterol, and the fractions for monomeric complex was collected and concentrated individually for electron microscopy experiments.
Cryo-EM data acquisition
3.5 μL of purified hGLP-1:rGLP-1R:Gs complex at a concentration of ~1 mg/ml complex was applied to glow-discharged holey carbon grids (Quantifoil R2/2, 300 mesh), and subsequently vitrified using a Vitrobot Mark IV (FEI Company). The specimen was visualized with a Titan Krios electron microscope (FEI) operating at 300 kV accelerating voltage, at a nominal magnification of 29,000X using a K2 Summit direct electron detector (Gatan, Inc.) in counting mode, corresponding to a pixel size of 1.0 Å on the specimen level. In total, 17,332 images with defocus values in the range of −1.5 to −3.0 μm were recorded with a dose rate of ~9.0 electrons per Å2 per second. The total exposure time was set to 10s with intermediate frames recorded every 0.2s, resulting in an accumulated dose of ~90 electrons per Å2 and a total of 50 frames per movie stack.
Image processing and 3D reconstructions
A total of 14,600 dose-fractionated image stacks were subjected to beam-induced motion correction using MotionCor244. A sum of all frames, filtered according to exposure dose, in each image stack was used for further processing. CTF parameters for each micrograph were determined by CTFFIND445.
Particle selection, two-dimensional classification and three-dimensional classification were performed on a binned dataset with a pixel size of 2 Å using RELION46–48. 2,675,742 particle projections were selected using semi-automated procedures and subjected to reference-free two-dimensional classification to discard false positive particles or particles categorized in poorly defined classes, resulting in 620,626 particle projections for further processing. An ab initio map generated with VIPER49 was used as initial reference model for maximum-likelihood-based three-dimensional classification. One stable class accounting for 139,299 particles showed detailed features for all subunits and was subsequently subjected to 3D refinement and reconstruction after subtracting densities for the mobile GαsAH domain and the detergent micelle from the raw micrographs. The final map has a global nominal resolution of 4.1 Å, with nominal resolution of 3.9-Å in the core region that includes GLP-1, TM and GαsRas α5 helix.
Reported resolutions are based on the “gold-standard” Fourier shell correlation (FSC) using the 0.143 criterion. All density maps were corrected for the modulation transfer function (MTF) of the K2 summit direct detector and then sharpened by applying temperature-factor that was estimated using post-processing in RELION. Local resolution was determined using ResMap50 with half-reconstructions as input maps.
Model building and refinement
The initial template of rGLP-1R TM domain was derived from a homology-based model calculated by I-TASSER51. The crystal structure of GLP-1R NTD:GLP-1 complex (PDB ID: 3IOL) and β2AR:Gs complex (PDB ID: 3SN6) were used as initial models for NTD-hGLP-1 and Gs heterotrimer, respectively. All models were docked into the EM density map using Chimera52, followed by iterative manual adjustment and real-space refinement using COOT53 and fragment-based refinement with Rosetta54. Sequence assignment was guided by bulky amino acid residues such as Phe, Tyr, Trp and Arg. The final model was subjected to global refinement and minimization in real space using the module phenix.real_space_refine in PHENIX55. Model overfitting was evaluated through its refinement against one cryo-EM half map. FSC curves were calculated between the resulting model and the half map used for refinement as well as between the resulting model and the other half map for cross-validation (Extended Data Figure 4). The final refinement statistics are provided in Supplementary Information Table S2.
Data availability
All data generated or analysed during this study are included in this published article and its Supplementary Information files. The cryo-EM density map has been deposited in the Electron Microscopy Data Bank under accession code EMD-8653 and the coordinates have been deposited in the Protein Data Bank under accession number 5VAI.
Extended Data
Extended Data Figure 1. Purification of the hGLP-1:rGLP-1R:Gs complex.
Size exclusion chromatography profile and corresponding SDS-PAGE gel of the purified hGLP-1:rGLP-1R:Gs complex.
Extended Data Figure 2. Cryo-EM micrograph and 2D class averages of the hGLP-1:rGLP-1R:Gs complex.
a, Cryo-EM micrograph of the activated GLP-1R:Gs complex. Examples of sample particle projections are circled (scale bar: 30 nm). b, Representative reference-free two-dimensional averages show distinct secondary structure features for G protein and GLP-1R embedded in MNG detergent micelle. The diameter of the circular windows is 17 nm.
Extended Data Figure 3. Single-particle cryo-EM analysis of the hGLP-1:rGLP-1R:Gs complex.
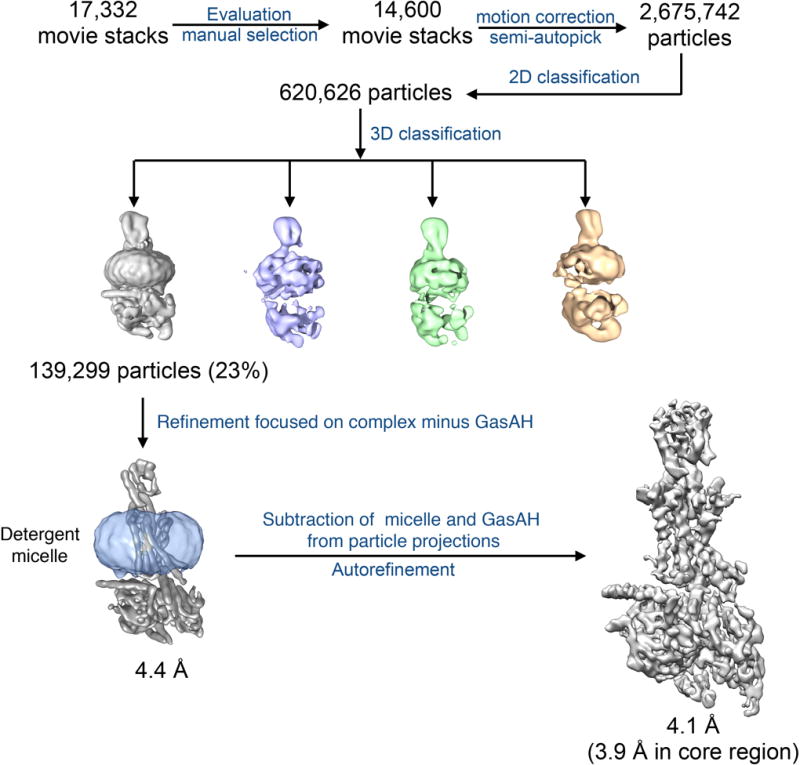
Flow chart of cryo-EM data processing of the hGLP-1:rGLP-1R:Gs complex, including particle projection selection, classification and 3D density map reconstruction, related to Figure 1. Details are provided in the Methods section.
Extended Data Figure 4. Resolution of cryo-EM map and validation of the hGLP-1:rGLP-1R:Gs structure.
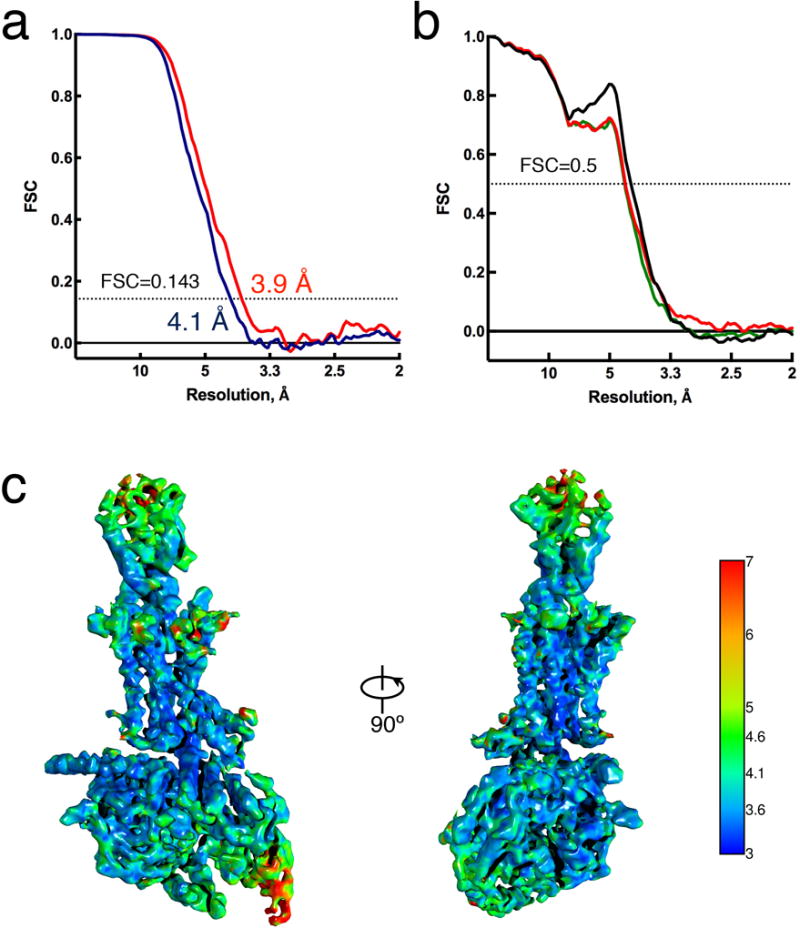
a, Resolution estimation of the EM map. “Gold standard” Fourier shell correlation (FSC) curves, showing the overall nominal resolution at 4.1 Å (blue) and 3.9 Å (red) on the stable region including hGLP-1, TM domain and GαsRas α5-helix. b, FSC curves of the final refined model versus the final cryo-EM map (full dataset, black), of the outcome of model refinement with a half map versus the same map (red), and of the outcome of model refinement with a half map versus the other half map (green). c, Final three-dimensional density map colored according to local resolution.
Extended Data Figure 5. A near-atomic resolution model of the hGLP-1:rGLP-1R:Gs complex.
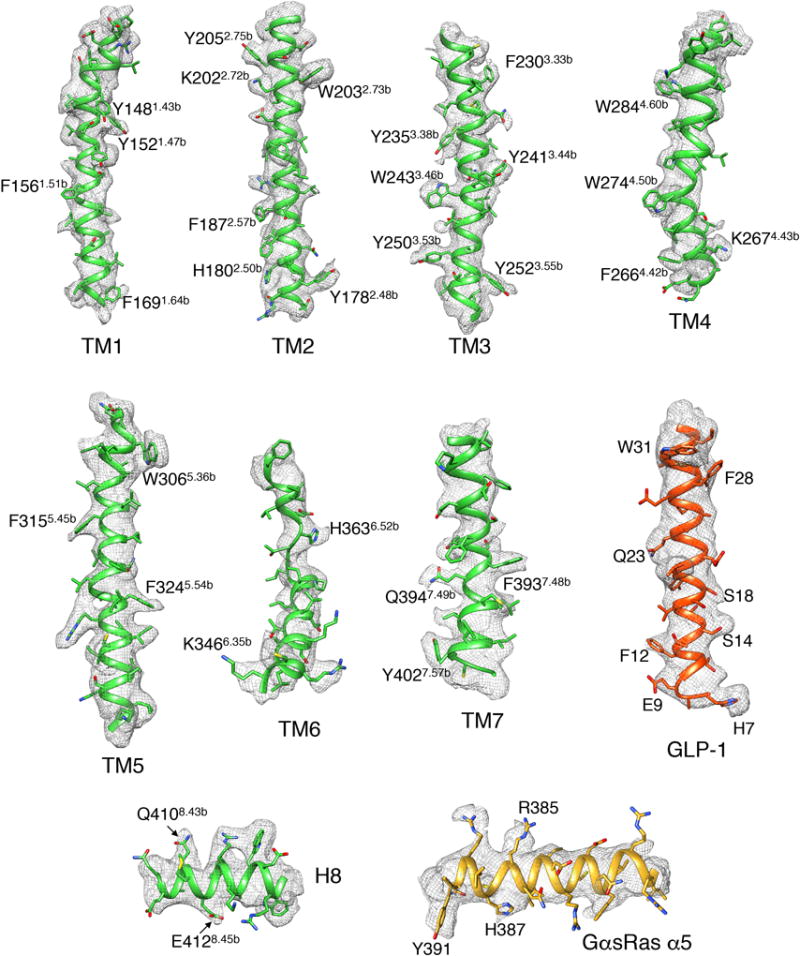
EM density map and model are shown for all seven TMs and H8 of rGLP-1R, hGLP-1 peptide and GαsRas α5-helix. Bulky resides are indicated for each segment. The C-terminal half of TM6 exhibits relatively poor density, reflecting its intrinsic flexibility.
Extended Data Figure 6. Features of cryo-EM map prior to density subtraction.
a, GLP-1R:Gs complex structure docked into cryo-EM density map prior to density subtraction. Arrows indicate the density corresponding to the linker between NTD and TM bundle, and Gβγlipid moiety inserting into the detergent micelle. b, Close-up view in this map shows density connecting H8 and Gβ at the position of R419 of H8 and G310-H311 of Gβ. Model is colored as in Figure 1c.
Extended Data Figure 7. Conformation of ECL2 in family B GPCRs.
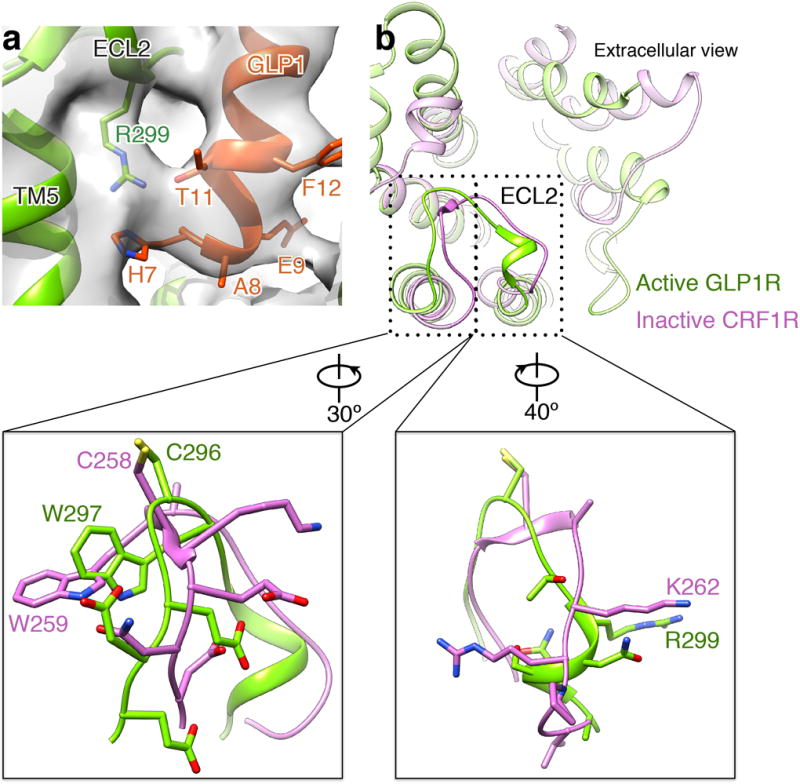
a, Close-up view of R299 of ECL2 modeled into the density map at low threshold shows that the Arg side chain reaches into the GLP-1 binding pocket in close proximity to H7 and T11 of the peptide. b, Top-down view of structural overlay of the active GLP-1R TMD and the inactive CRF1R TMD (PDB code: 4K5Y) indicates the conformational similarity of ECL2s in the two structures. Detailed views of boxed regions show that W297 and R299 in the active GLP-1R structure adopt similar orientations compared to the equivalent residues in CRF1R. Model of GLP-1R complex is colored as in Figure 1c. CRF1R is colored orchid.
Extended Data Figure 8. Structures of family B GPCR ligands bound to NTDs.
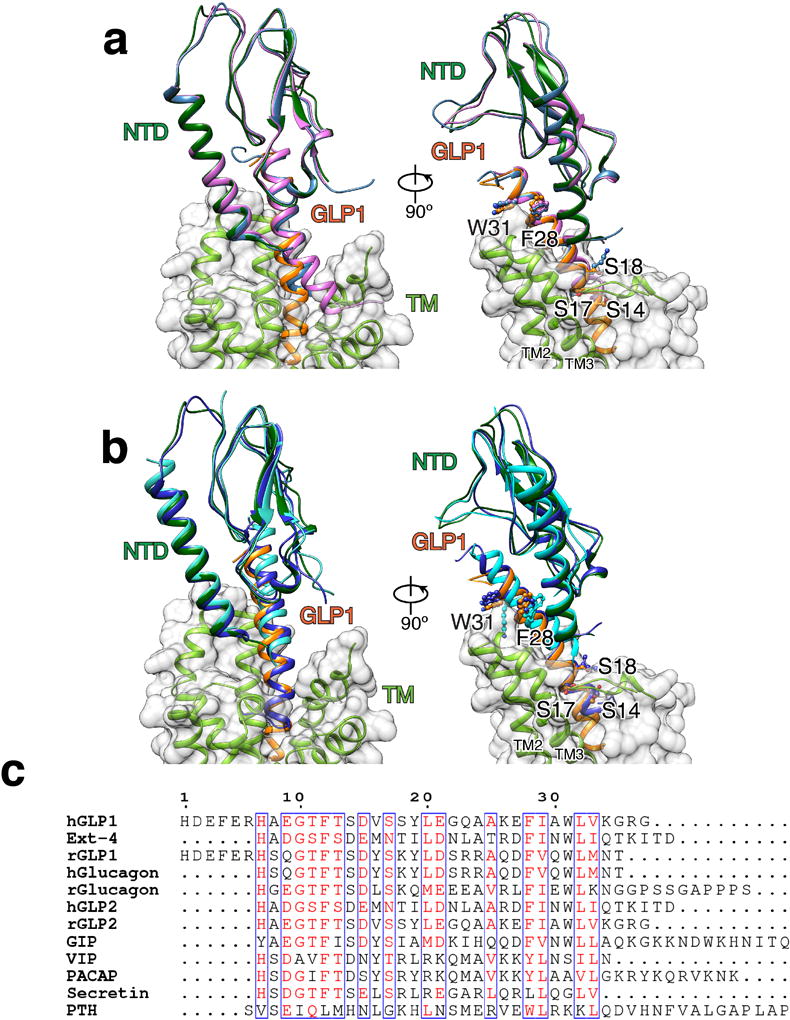
a, Structural superposition of the cryo-EM structure of GLP-1R NTD bound to GLP-1 to crystal structures with clinical peptide Exendin-4 (ocean blue) and GLP-1 (orchid), respectively. The model of hGLP-1:rGLP-1R:Gs is colored as in Figure 1. b, Structural superposition of the cryo-EM structure of GLP-1R NTD bound to GLP-1 to crystal structures of GIPR NTD:GIP (blue) and PTH-1R NTD:PTH (cyan). a–b, Residues S14, S17, S18, F28 and W31 of GLP-1 and equivalent residues in the other peptides are shown in ball and stick (right panel only), highlighting that the corresponding side chains adopt similar conformation in all available structures. c, Structure-based alignment of selected family B GPCR peptide ligand sequences.
Extended Data Figure 9. Potential NTD-TM interaction, orthosteric agonist binding pocket in GLP-1R and β2AR.
a, Close-up view of the model docked into cryo-EM density map (grey) on the region of NTD-TM at low threshold shows the potential hydrogen bond between Q213 of ECL1 and R40 of NTD α1-helix. b, Overlay of GPCR TM bundles in the activated GLP-1R complex and T4L-β2AR:Gs:Nb35 complex shown in light green and grey, respectively. Cut-through view showing that the GLP-1 peptide N-terminal H7 (orange ball and stick) reaches the same level as the orthosteric agonist BI-167107 (yellow).
Extended Data Figure 10. Comparison of G protein trimer structures from activated GLP-1R:Gs:Nb35 complex and T4L-β2AR:Gs:Nb35 complex with alignment on GαsRas alone, related to Figure 5.
a, Views of superposition of G protein trimer structures from the activated GLP-1R:Gs structure (GαsRas in gold, Gβ in light blue, Gγ in dark blue) and T4L-β2AR:Gs structure (all colored in grey). b, Schematic representation of recognition between C-terminus of α5-helix (H387-L394) and active receptors of β2AR (c) and GLP-1R (d). The sequence of C-terminus of α5-helix (H387-L394) is shown in the middle in gold. Residues involving in the interaction with α5-helix (H387-L394) in the receptor of β2AR (green box) and GLP-1R (orchid box) are shown over and below, respectively. Hydrophobic interactions are shown in blue and polar interactions in red. Ballesteros-Weinstein numbering in superscript is shown.
Supplementary Material
Acknowledgments
We thank M. Su for support with electron microscopy, W. Weis for comments on model refinement, and S. Reedtz-Runge, T. Egebjerg and N. Kulahin for suggesting the rabbit GLP-1R as a candidate for structural studies. This work was supported by NIH grants DK090165 and NS092695 (to G.S.) and R44 DK106942 (to ConfometRx).
Footnotes
Supplementary Information is available in the online version of the paper.
Author Contributions
Y.Z. performed cryo-EM map calculation, model building and refinement; B.S. established GLP-1:GLP-1R:Gs complex formation strategy; B.S., D.F. and M.C. expressed and purified the complex; S.L. prepared Gs protein; H.H., Q.Q., Y.Z. acquired cryo-EM data; J.T.T. assisted in specimen screening by negative stain EM; Y.Z., B.K.K. and G.S. analyzed the data and wrote the manuscript; T.S.K, B.K.K. and G.S. supervised the project.
The authors declare no competing financial interests.
References
- 1.Drucker DJ. The Cardiovascular Biology of Glucagon-like Peptide-1. Cell Metab. 2016;24:15–30. doi: 10.1016/j.cmet.2016.06.009. [DOI] [PubMed] [Google Scholar]
- 2.Cho YM, Merchant CE, Kieffer TJ. Targeting the glucagon receptor family for diabetes and obesity therapy. Pharmacol. Ther. 2012;135:247–278. doi: 10.1016/j.pharmthera.2012.05.009. [DOI] [PubMed] [Google Scholar]
- 3.Lagerstrom MC, Schioth HB. Structural diversity of G protein-coupled receptors and significance for drug discovery. Nat. Rev. Drug Discov. 2008;7:339–357. doi: 10.1038/nrd2518. [DOI] [PubMed] [Google Scholar]
- 4.Runge S, Thogersen H, Madsen K, Lau J, Rudolph R. Crystal structure of the ligand-bound glucagon-like peptide-1 receptor extracellular domain. J. Biol. Chem. 2008;283:11340–11347. doi: 10.1074/jbc.M708740200. [DOI] [PubMed] [Google Scholar]
- 5.Underwood CR, et al. Crystal structure of glucagon-like peptide-1 in complex with the extracellular domain of the glucagon-like peptide-1 receptor. J. Biol. Chem. 2010;285:723–730. doi: 10.1074/jbc.M109.033829. [DOI] [PMC free article] [PubMed] [Google Scholar]
- 6.Castro M, Nikolaev VO, Palm D, Lohse MJ, Vilardaga JP. Turn-on switch in parathyroid hormone receptor by a two-step parathyroid hormone binding mechanism. Proc. Natl. Acad. Sci. U.S.A. 2005;102:16084–16089. doi: 10.1073/pnas.0503942102. [DOI] [PMC free article] [PubMed] [Google Scholar]
- 7.Culhane KJ, Liu Y, Cai Y, Yan EC. Transmembrane signal transduction by peptide hormones via family B G protein-coupled receptors. Front. Pharmacol. 2015;6:264. doi: 10.3389/fphar.2015.00264. [DOI] [PMC free article] [PubMed] [Google Scholar]
- 8.Jazayeri A, et al. Extra-helical binding site of a glucagon receptor antagonist. Nature. 2016;533:274–277. doi: 10.1038/nature17414. [DOI] [PubMed] [Google Scholar]
- 9.Siu FY, et al. Structure of the human glucagon class B G-protein-coupled receptor. Nature. 2013;499:444–449. doi: 10.1038/nature12393. [DOI] [PMC free article] [PubMed] [Google Scholar]
- 10.Hollenstein K, et al. Structure of class B GPCR corticotropin-releasing factor receptor 1. Nature. 2013;499:438–443. doi: 10.1038/nature12357. [DOI] [PubMed] [Google Scholar]
- 11.Yan C, Wan R, Bai R, Huang G, Shi Y. Structure of a yeast step II catalytically activated spliceosome. Science. 2017;355:149–155. doi: 10.1126/science.aak9979. [DOI] [PubMed] [Google Scholar]
- 12.Bai XC, et al. An atomic structure of human gamma-secretase. Nature. 2015;525:212–217. doi: 10.1038/nature14892. [DOI] [PMC free article] [PubMed] [Google Scholar]
- 13.Peng W, et al. Structural basis for the gating mechanism of the type 2 ryanodine receptor RyR2. Science. 2016:354. doi: 10.1126/science.aah5324. [DOI] [PubMed] [Google Scholar]
- 14.Manglik A, et al. Structural Insights into the Dynamic Process of beta2-Adrenergic Receptor Signaling. Cell. 2015;161:1101–1111. doi: 10.1016/j.cell.2015.04.043. [DOI] [PMC free article] [PubMed] [Google Scholar]
- 15.Nygaard R, et al. The dynamic process of beta(2)-adrenergic receptor activation. Cell. 2013;152:532–542. doi: 10.1016/j.cell.2013.01.008. [DOI] [PMC free article] [PubMed] [Google Scholar]
- 16.Rasmussen SG, et al. Crystal structure of the beta2 adrenergic receptor-Gs protein complex. Nature. 2011;477:549–555. doi: 10.1038/nature10361. [DOI] [PMC free article] [PubMed] [Google Scholar]
- 17.Shukla AK, et al. Visualization of arrestin recruitment by a G-protein-coupled receptor. Nature. 2014;512:218–222. doi: 10.1038/nature13430. [DOI] [PMC free article] [PubMed] [Google Scholar]
- 18.Peisley A, Skiniotis G. 2D Projection Analysis of GPCR Complexes by Negative Stain Electron Microscopy. Methods Mol. Biol. 2015;1335:29–38. doi: 10.1007/978-1-4939-2914-6_3. [DOI] [PubMed] [Google Scholar]
- 19.Westfield GH, et al. Structural flexibility of the G alpha s alpha-helical domain in the beta2-adrenoceptor Gs complex. Proc. Natl. Acad. Sci. U.S.A. 2011;108:16086–16091. doi: 10.1073/pnas.1113645108. [DOI] [PMC free article] [PubMed] [Google Scholar]
- 20.Koole C, et al. Second extracellular loop of human glucagon-like peptide-1 receptor (GLP-1R) has a critical role in GLP-1 peptide binding and receptor activation. J. Biol. Chem. 2012;287:3642–3658. doi: 10.1074/jbc.M111.309328. [DOI] [PMC free article] [PubMed] [Google Scholar]
- 21.Yang D, et al. Structural Determinants of Binding the Seven-transmembrane Domain of the Glucagon-like Peptide-1 Receptor (GLP-1R) J. Biol. Chem. 2016;291:12991–13004. doi: 10.1074/jbc.M116.721977. [DOI] [PMC free article] [PubMed] [Google Scholar]
- 22.Coopman K, et al. Residues within the transmembrane domain of the glucagon-like peptide-1 receptor involved in ligand binding and receptor activation: modelling the ligand-bound receptor. Mol. Endocrinol. 2011;25:1804–1818. doi: 10.1210/me.2011-1160. [DOI] [PMC free article] [PubMed] [Google Scholar]
- 23.Perret J, et al. Mutational analysis of the glucagon receptor: similarities with the vasoactive intestinal peptide (VIP)/pituitary adenylate cyclase-activating peptide (PACAP)/secretin receptors for recognition of the ligand's third residue. Biochem. J. 2002;362:389–394. doi: 10.1042/0264-6021:3620389. [DOI] [PMC free article] [PubMed] [Google Scholar]
- 24.Xiao Q, Jeng W, Wheeler MB. Characterization of glucagon-like peptide-1 receptor-binding determinants. J. Mol. Endocrinol. 2000;25:321–335. doi: 10.1677/jme.0.0250321. [DOI] [PubMed] [Google Scholar]
- 25.Wootten D, Simms J, Miller LJ, Christopoulos A, Sexton PM. Polar transmembrane interactions drive formation of ligand-specific and signal pathway-biased family B G protein-coupled receptor conformations. Proc. Natl. Acad. Sci. U.S.A. 2013;110:5211–5216. doi: 10.1073/pnas.1221585110. [DOI] [PMC free article] [PubMed] [Google Scholar]
- 26.Yaqub T, et al. Identification of determinants of glucose-dependent insulinotropic polypeptide receptor that interact with N-terminal biologically active region of the natural ligand. Mol. Pharmacol. 2010;77:547–558. doi: 10.1124/mol.109.060111. [DOI] [PubMed] [Google Scholar]
- 27.Di Paolo E, et al. Contribution of the second transmembrane helix of the secretin receptor to the positioning of secretin. FEBS Lett. 1998;424:207–210. doi: 10.1016/s0014-5793(98)00175-6. [DOI] [PubMed] [Google Scholar]
- 28.Dods RL, Donnelly D. The peptide agonist-binding site of the glucagon-like peptide-1 (GLP-1) receptor based on site-directed mutagenesis and knowledge-based modelling. Biosci. Rep. 2015;36:e00285. doi: 10.1042/BSR20150253. [DOI] [PMC free article] [PubMed] [Google Scholar]
- 29.Wootten D, et al. The Extracellular Surface of the GLP-1 Receptor Is a Molecular Trigger for Biased Agonism. Cell. 2016;165:1632–1643. doi: 10.1016/j.cell.2016.05.023. [DOI] [PMC free article] [PubMed] [Google Scholar]
- 30.Roberts DJ, Vertongen P, Waelbroeck M. Analysis of the glucagon receptor first extracellular loop by the substituted cysteine accessibility method. Peptides. 2011;32:1593–1599. doi: 10.1016/j.peptides.2011.06.009. [DOI] [PubMed] [Google Scholar]
- 31.Barwell J, Conner A, Poyner DR. Extracellular loops 1 and 3 and their associated transmembrane regions of the calcitonin receptor-like receptor are needed for CGRP receptor function. Biochim. Biophys. Acta. 2011;1813:1906–1916. doi: 10.1016/j.bbamcr.2011.06.005. [DOI] [PMC free article] [PubMed] [Google Scholar]
- 32.Yang L, et al. Conformational states of the full-length glucagon receptor. Nat Commun. 2015;6:7859. doi: 10.1038/ncomms8859. [DOI] [PMC free article] [PubMed] [Google Scholar]
- 33.Parthier C, Reedtz-Runge S, Rudolph R, Stubbs MT. Passing the baton in class B GPCRs: peptide hormone activation via helix induction? Trends Biochem. Sci. 2009;34:303–310. doi: 10.1016/j.tibs.2009.02.004. [DOI] [PubMed] [Google Scholar]
- 34.Donnelly D. The structure and function of the glucagon-like peptide-1 receptor and its ligands. Br. J. Pharmacol. 2012;166:27–41. doi: 10.1111/j.1476-5381.2011.01687.x. [DOI] [PMC free article] [PubMed] [Google Scholar]
- 35.Ballesteros JA, Weinstein H. Integrated methods for the construction of three-dimensional models and computational probing of structure-function relations in G protein-coupled receptors. Methods Neurosci. 1995;25:366–428. [Google Scholar]
- 36.Fredriksson R, Lagerstrom MC, Lundin LG, Schioth HB. The G-protein-coupled receptors in the human genome form five main families. Phylogenetic analysis, paralogon groups, and fingerprints. Mol. Pharmacol. 2003;63:1256–1272. doi: 10.1124/mol.63.6.1256. [DOI] [PubMed] [Google Scholar]
- 37.Bailey RJ, Hay DL. Agonist-dependent consequences of proline to alanine substitution in the transmembrane helices of the calcitonin receptor. Br. J. Pharmacol. 2007;151:678–687. doi: 10.1038/sj.bjp.0707246. [DOI] [PMC free article] [PubMed] [Google Scholar]
- 38.Conner AC, et al. A key role for transmembrane prolines in calcitonin receptor-like receptor agonist binding and signalling: implications for family B G-protein-coupled receptors. Mol. Pharmacol. 2005;67:20–31. [PubMed] [Google Scholar]
- 39.Rasmussen SG, et al. Crystal structure of the human beta2 adrenergic G-protein-coupled receptor. Nature. 2007;450:383–387. doi: 10.1038/nature06325. [DOI] [PubMed] [Google Scholar]
- 40.Hjorth SA, Orskov C, Schwartz TW. Constitutive activity of glucagon receptor mutants. Mol. Endocrinol. 1998;12:78–86. doi: 10.1210/mend.12.1.0045. [DOI] [PubMed] [Google Scholar]
- 41.Schipani E, Kruse K, Juppner H. A constitutively active mutant PTH-PTHrP receptor in Jansen-type metaphyseal chondrodysplasia. Science. 1995;268:98–100. doi: 10.1126/science.7701349. [DOI] [PubMed] [Google Scholar]
- 42.Wootten D, et al. Key interactions by conserved polar amino acids located at the transmembrane helical boundaries in Class B GPCRs modulate activation, effector specificity and biased signalling in the glucagon-like peptide-1 receptor. Biochem. Pharmacol. 2016;118:68–87. doi: 10.1016/j.bcp.2016.08.015. [DOI] [PMC free article] [PubMed] [Google Scholar]
- 43.Venkatakrishnan AJ, et al. Diverse activation pathways in class A GPCRs converge near the G-protein-coupling region. Nature. 2016;536:484–487. doi: 10.1038/nature19107. [DOI] [PMC free article] [PubMed] [Google Scholar]
- 44.Zheng SQ, et al. MotionCor2: anisotropic correction of beam-induced motion for improved cryo-electron microscopy. Nat. Methods. 2017 doi: 10.1038/nmeth.4193. [DOI] [PMC free article] [PubMed] [Google Scholar]
- 45.Rohou A, Grigorieff N. CTFFIND4: Fast and accurate defocus estimation from electron micrographs. J. Struct. Biol. 2015;192:216–221. doi: 10.1016/j.jsb.2015.08.008. [DOI] [PMC free article] [PubMed] [Google Scholar]
- 46.Scheres SH. RELION: implementation of a Bayesian approach to cryo-EM structure determination. J. Struct. Biol. 2012;180:519–530. doi: 10.1016/j.jsb.2012.09.006. [DOI] [PMC free article] [PubMed] [Google Scholar]
- 47.Scheres SH. Semi-automated selection of cryo-EM particles in RELION-1.3. J. Struct. Biol. 2015;189:114–122. doi: 10.1016/j.jsb.2014.11.010. [DOI] [PMC free article] [PubMed] [Google Scholar]
- 48.Scheres SH. Processing of Structurally Heterogeneous Cryo-EM Data in RELION. Methods Enzymol. 2016;579:125–157. doi: 10.1016/bs.mie.2016.04.012. [DOI] [PubMed] [Google Scholar]
- 49.Penczek PA, Grassucci RA, Frank J. The ribosome at improved resolution: New techniques for merging and orientation refinement in 3D cryo-electron microscopy of biological particles. Ultramicroscopy. 1994;53:251–270. doi: 10.1016/0304-3991(94)90038-8. [DOI] [PubMed] [Google Scholar]
- 50.Kucukelbir A, Sigworth FJ, Tagare HD. Quantifying the local resolution of cryo-EM density maps. Nat Methods. 2014;11:63–65. doi: 10.1038/nmeth.2727. [DOI] [PMC free article] [PubMed] [Google Scholar]
- 51.Yang J, et al. The I-TASSER Suite: protein structure and function prediction. Nat. Methods. 2015;12:7–8. doi: 10.1038/nmeth.3213. [DOI] [PMC free article] [PubMed] [Google Scholar]
- 52.Pettersen EF, et al. UCSF Chimera--a visualization system for exploratory research and analysis. J. Comput. Chem. 2004;25:1605–1612. doi: 10.1002/jcc.20084. [DOI] [PubMed] [Google Scholar]
- 53.Emsley P, Cowtan K. Coot: model-building tools for molecular graphics. Acta Crystallogr. D Biol. Crystallogr. 2004;60:2126–2132. doi: 10.1107/S0907444904019158. [DOI] [PubMed] [Google Scholar]
- 54.Wang RY, et al. Automated structure refinement of macromolecular assemblies from cryo-EM maps using Rosetta. Elife. 2016;5 doi: 10.7554/eLife.17219. [DOI] [PMC free article] [PubMed] [Google Scholar]
- 55.Adams PD, et al. PHENIX: a comprehensive Python-based system for macromolecular structure solution. Acta Crystallogr. D Biol. Crystallogr. 2010;66:213–221. doi: 10.1107/S0907444909052925. [DOI] [PMC free article] [PubMed] [Google Scholar]
Associated Data
This section collects any data citations, data availability statements, or supplementary materials included in this article.
Supplementary Materials
Data Availability Statement
All data generated or analysed during this study are included in this published article and its Supplementary Information files. The cryo-EM density map has been deposited in the Electron Microscopy Data Bank under accession code EMD-8653 and the coordinates have been deposited in the Protein Data Bank under accession number 5VAI.


