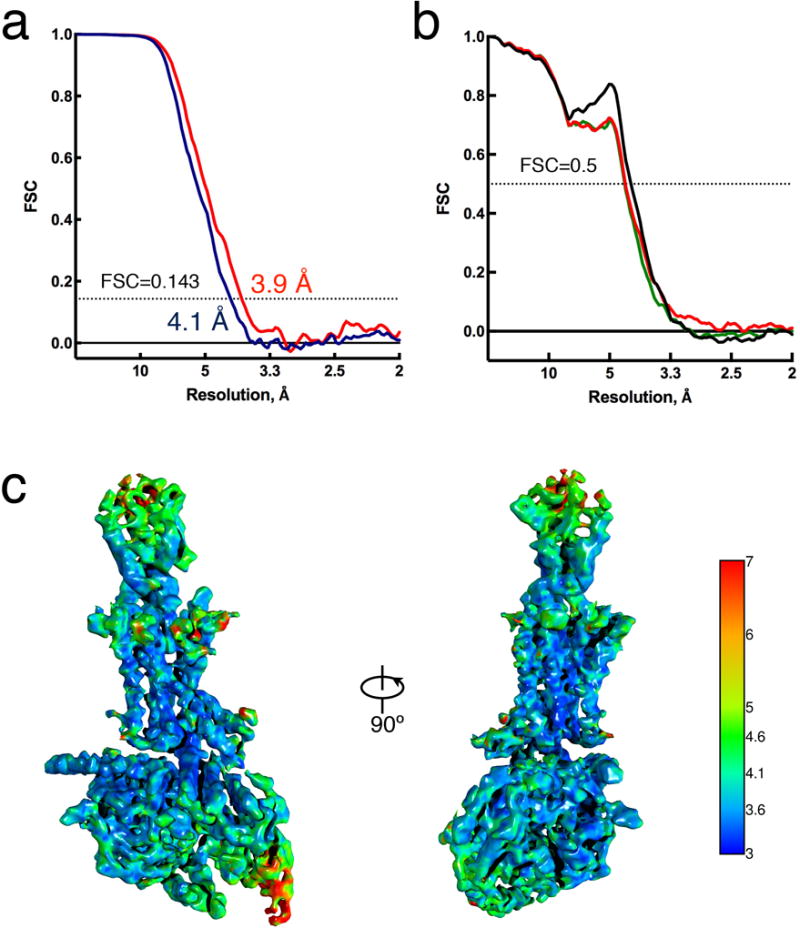
Extended Data Figure 4. Resolution of cryo-EM map and validation of the hGLP-1:rGLP-1R:Gs structure.

a, Resolution estimation of the EM map. “Gold standard” Fourier shell correlation (FSC) curves, showing the overall nominal resolution at 4.1 Å (blue) and 3.9 Å (red) on the stable region including hGLP-1, TM domain and GαsRas α5-helix. b, FSC curves of the final refined model versus the final cryo-EM map (full dataset, black), of the outcome of model refinement with a half map versus the same map (red), and of the outcome of model refinement with a half map versus the other half map (green). c, Final three-dimensional density map colored according to local resolution.
