
Extended Data Figure 5. A near-atomic resolution model of the hGLP-1:rGLP-1R:Gs complex.
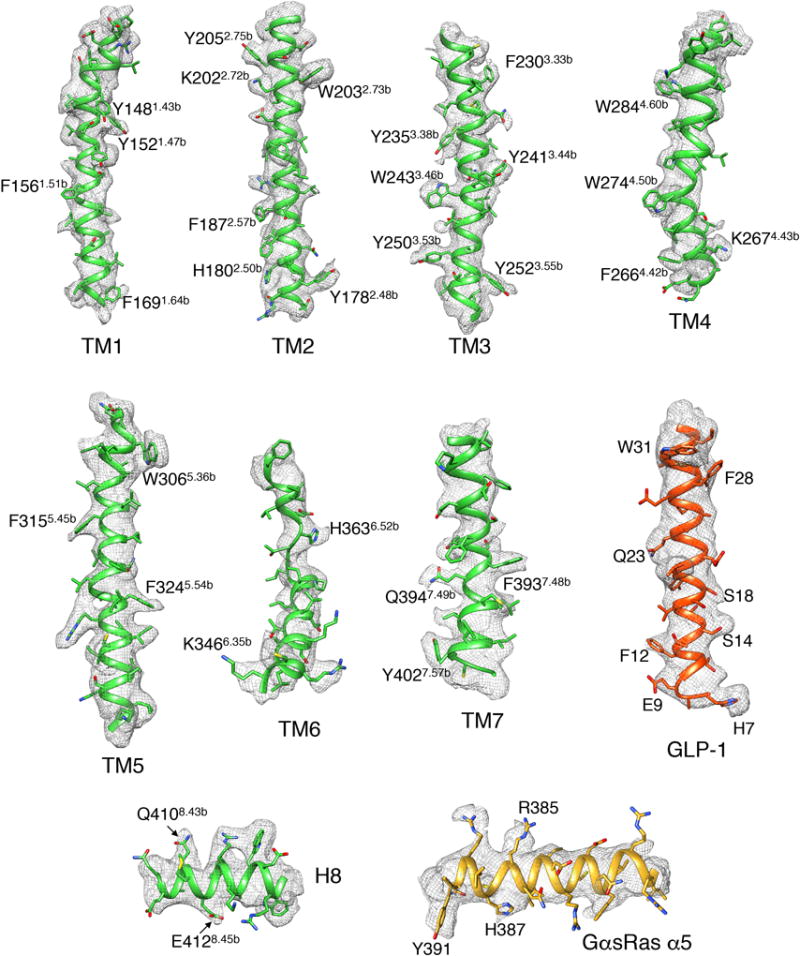
EM density map and model are shown for all seven TMs and H8 of rGLP-1R, hGLP-1 peptide and GαsRas α5-helix. Bulky resides are indicated for each segment. The C-terminal half of TM6 exhibits relatively poor density, reflecting its intrinsic flexibility.