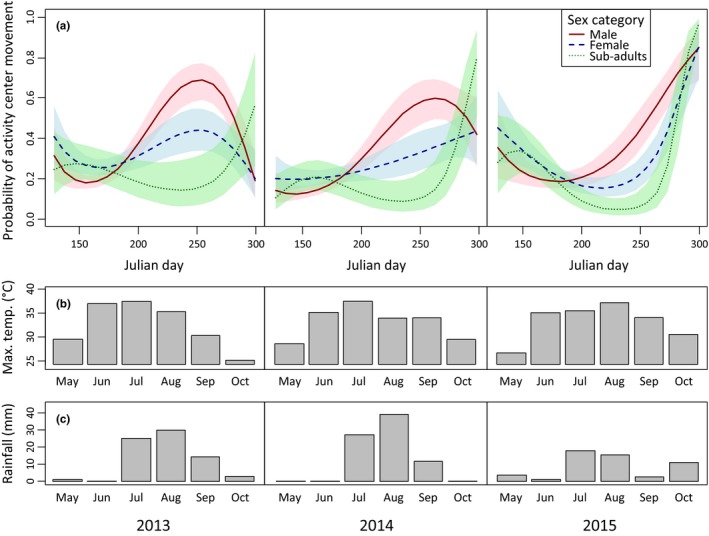
Figure 4.

Seasonal changes in the probability of activity center movement by tortoises, as well as seasonal changes in weather in the Ivanpah Valley, California, U.S.A., 2013–2015. Each column represents a different year, and rows indicate (a) variation in tortoise movement by sex category, (b) monthly maximum temperatures (max. temp.), and (c) monthly precipitation totals (rainfall). Shading in panel (a) indicates 95% confidence intervals.
