
Figure 2.
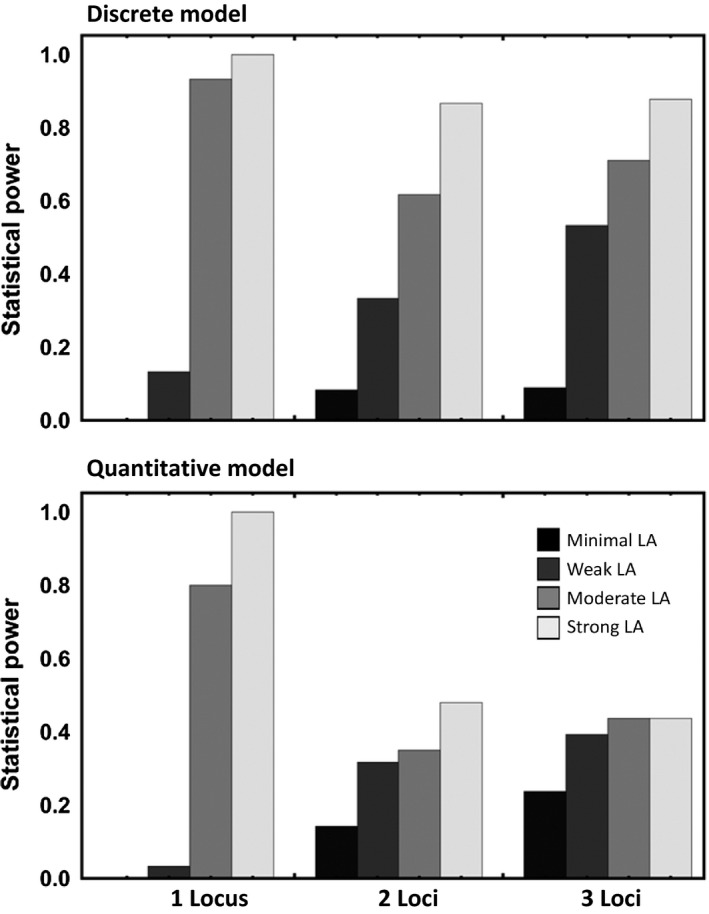
Statistical power as a function of the strength of local adaptation (bar shading) and the number of loci (bar groups) for the discrete matching model (top panel) and the quantitative matching model (bottom panel). Values of local adaptation were (black bars), (dark gray bars), (gray bars), and (light gray bars). Data results from simulations where forty populations were sampled, and the significance level, α, was set to 0.01