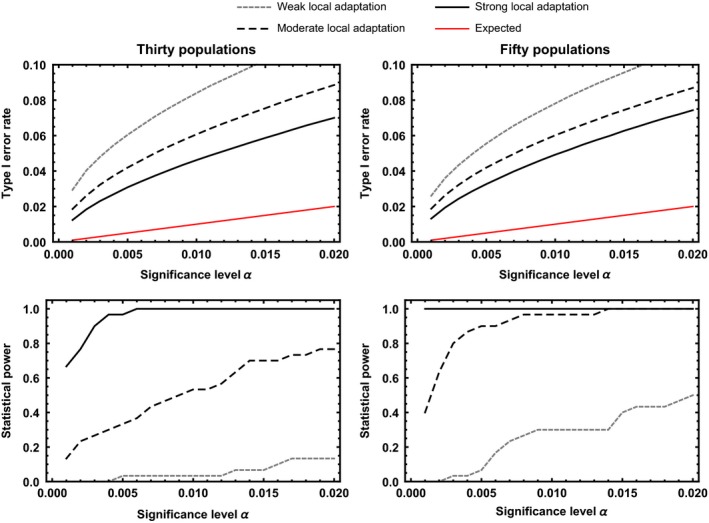
Figure 5.

Type I error rates and statistical power for the quantitative matching model as a function of the significance level, α, for three different levels of local adaptation and cases where thirty populations are sampled (left hand column) or fifty populations are sampled (right hand column). The gray‐dotted line shows cases where local adaptation is modest (), and in such cases, statistical power is low unless a large number of populations is sampled. The black‐dashed line shows cases where local adaptation is more substantial (), and in such cases, statistical power is substantially improved. The solid black line shows cases where local adaptation is strong , and in such cases, statistical power is very good, even when only thirty populations are sampled. The red line shows the expected type I error rate given the significance level, α
