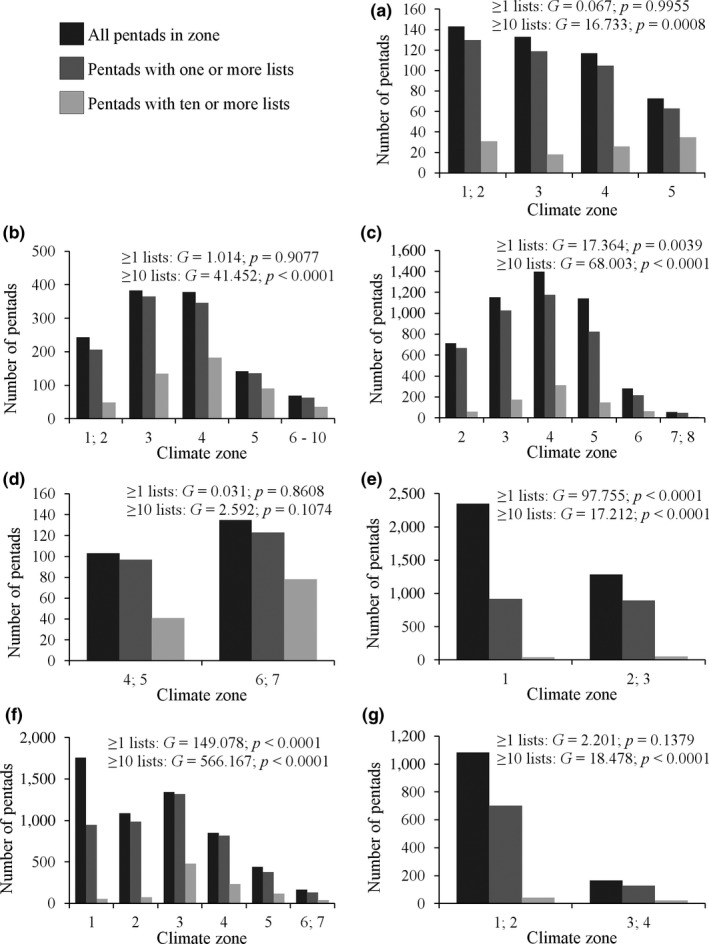
Figure 3.

A comparison between the total number of pentads, the number of pentads that had been sampled at least once, and the number of pentads sampled at least ten times. This is shown for distinct environmental zones (subsets with varying numbers of pentads) comprising seven biomes, (a) Albany Thicket, (b) Fynbos, (c) Grassland, (d) Indian Ocean Coastal Belt, (e) Nama Karoo, (f) Savanna, and (g) Succulent Karoo, subdivided into ten climate zones, with the smallest zones concatenated. At each biome, we indicate the results of G‐tests of independence comparing all pentads with sampled pentads among the climate zones within each biome
