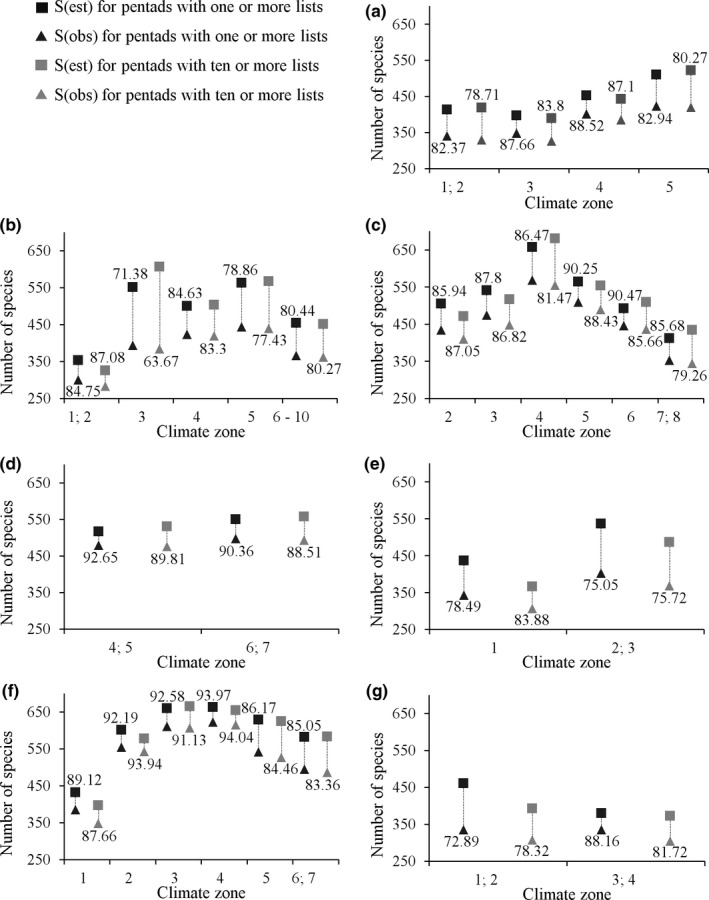
Figure 4.

A comparison of observed, S(obs), and estimated, S(est), species richness for pentads that had been sampled at least once and at least ten times. This comparison was made for distinct environmental zones comprising seven biomes, (a) Albany Thicket, (b) Fynbos, (c) Grassland, (d) Indian Ocean Coastal Belt, (e) Nama Karoo, (f) Savanna, and (g) Succulent Karoo, subdivided into ten climate zones (Fig. S3). Labels indicate the ratio (as percentage) between S(obs) and S(est), which indicates the completeness of the species inventory for each environmental zone
