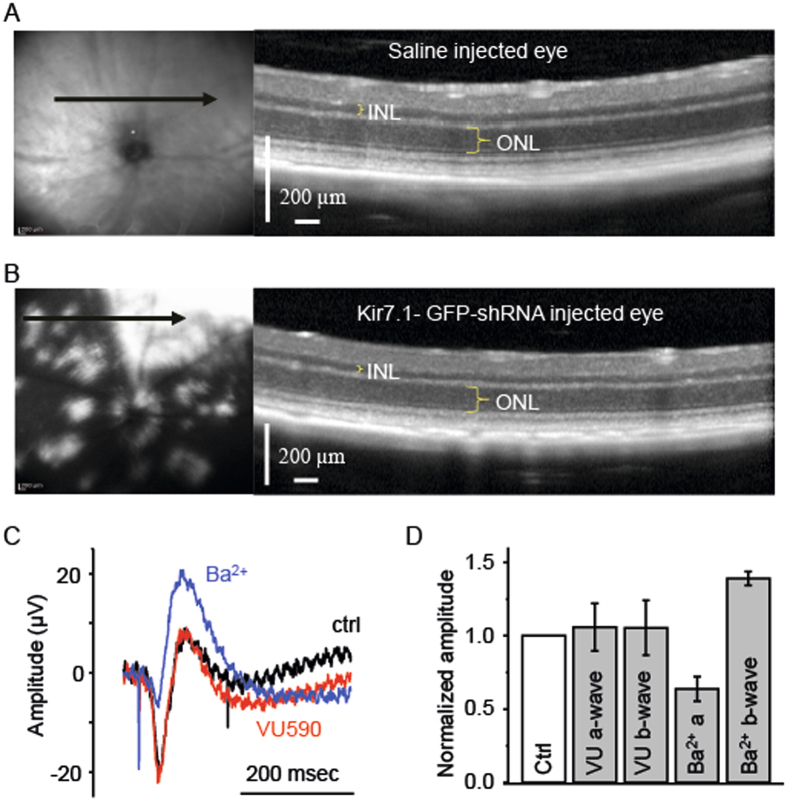
Figure 5.
Optical Coherence Tomography imaging of saline (A) and shRNA (B) injected eyes to visualize the structural integrity of the RPE and retina. In both panels A and B, the fundus photo shown in the left panel indicates the orientation (arrow) of the cross-sectional OCT. The scanned images with the outer nuclear (ONL) and inner nuclear (INL) layers is highlighted in the panel on the right. In image B, GFP fluorescence is evident in the white patches. (C) Ex-vivo ERG allows recording the response from the retina, only. ERG traces from the retina before (black) and after the treatment with 50 µM VU590 (red) are shown. The proper functioning of the ERG and the retina is confirmed by the treatment with 100 µM Ba2+ (blue). (D) Bar graph representing the amplitude of a- and b-waves in ex-vivo ERG recording after treatment with VU590 and Ba2+ are shown as compared to control.

